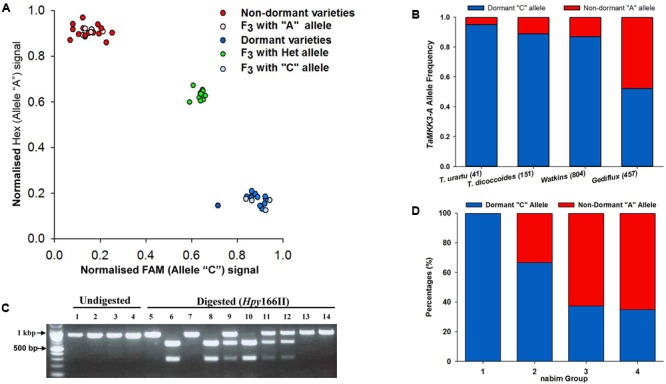
FIGURE 2.

Marker development and allele distribution of MKK3-A in ancestral and historic germplasm. (A) Genotype plot of varieties and a F3 population segregating for Phs-A1 using the TaMKK3-A KASP assay. (B) Development of co-dominant CAPS marker based on Hpy166II restriction digest of the C660A SNP. Lanes 1 - 4 contain undigested fragments of Robigus, Alchemy, Claire and Option, respectively, while Lanes 5 – 14 contain digested fragments of Robigus, Alchemy, Claire and Option (lanes 5–8) and six segregating F3 plants from an Alchemy × Robigus cross (lanes 9–16). (C) Allele frequency of the causal C660A SNP in T. urartu and T. turgidum ssp. dicoccoides accessions and the Watkins and Gediflux collections. The number of lines genotyped in each germplasm set is in parenthesis. (D) TaMKK3-A allele distribution in the four wheat end-use groups (nabim 1–4) in the United Kingdom. The red and blue bars in (C,D) represents the non-dormant “A” allele” and dormant “C” allele, respectively.
