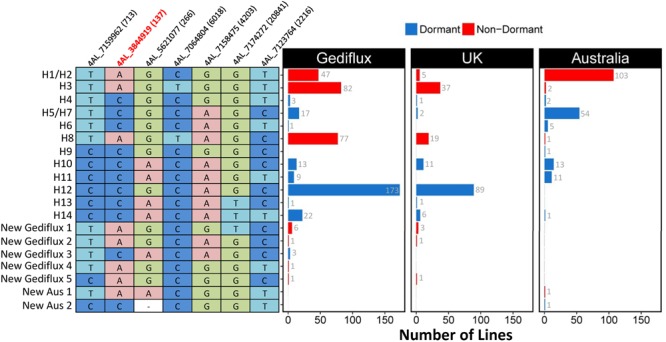
FIGURE 4.

Relationship between the European, United Kingdom, Australian and HapMap Phs-A1 Haplotypes. The distribution (bar charts) of the HapMap and unique haplotypes found in the Gediflux (European), United Kingdom and Australian germplasm using genotype information of seven of the 39 HapMap SNPs within the Phs-A1 interval. Red bars correspond to the non-dormant “A” allele, whereas blue bars correspond to the dormant “C” allele.
