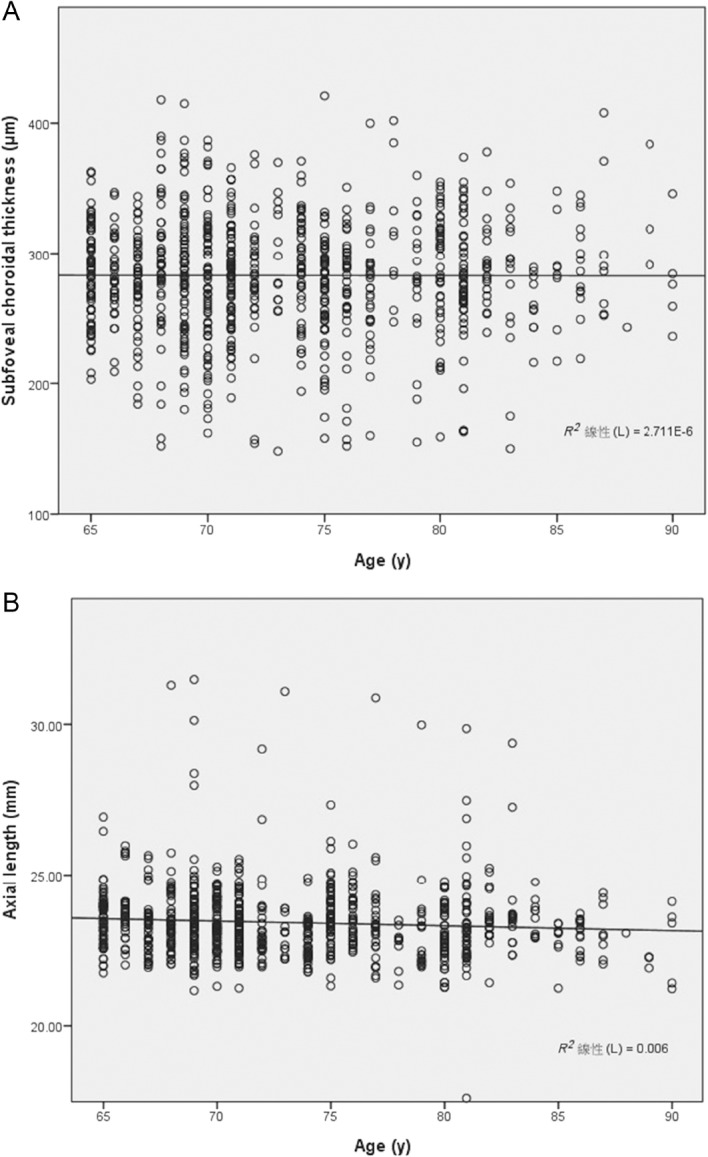
Fig. 3.

(A) Scatterplot of subfoveal choroidal thickness with age, showing the subfoveal choroidal thickness with age in this series of all eyes (r=−0.0016, p = 0.967); (B) scatterplot of axial length with age, showing the axial length with age in this series of all eyes (r = −0.0775, p = 0.043).
