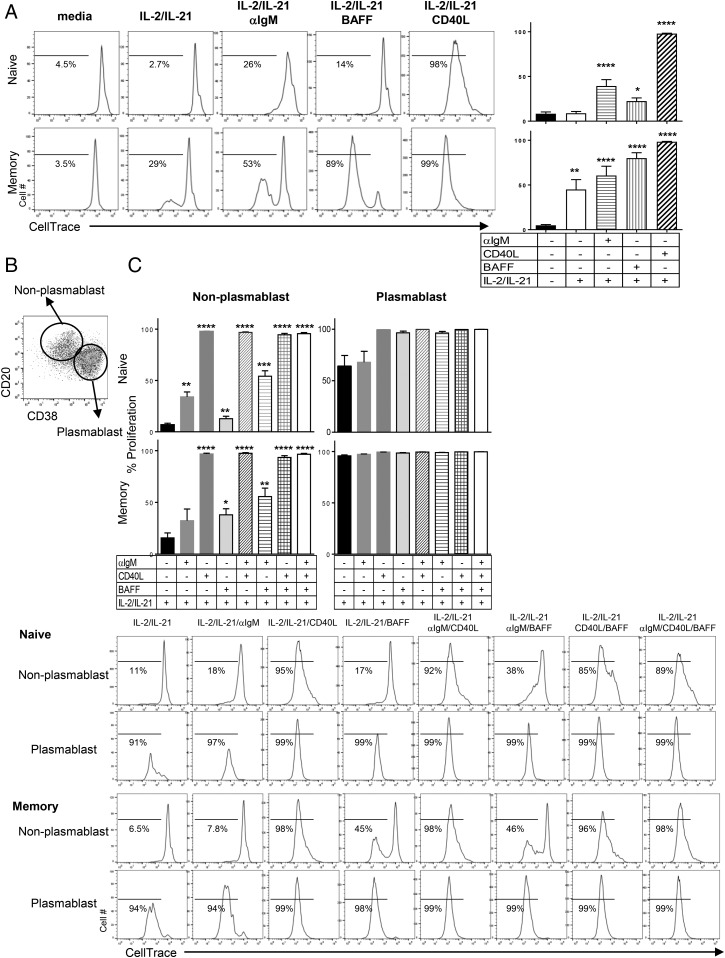
FIGURE 2.
Plasmablasts induced by anti-IgM, CD40L, or BAFF are actively dividing B cells. (A) Representative histogram for dividing cells by CellTrace dilution (left). The numbers in histograms are percent of dividing cells among CD19+ B cells. Graphs shown (right) are the mean percent ± SEM of the number of dividing cells in naive (top) and memory (bottom) B cells after 5 d stimulation with the indicated conditions. (B) Representative dot plot for gating of plasmablast and nonplasmablasts. CD19+ B cells were gated as plasmablast (CD20loCD38hi) and nonplasmablast (CD20hiCD38lo), and analyzed for proliferation by CellTrace dilution. (C) Graphs are shown as the mean percent ± SEM of dividing cells in nonplasmablast (left) and plasmablast (right) from naive (top) and memory (bottom) B cells under the indicated conditions on day 5. Representative histograms from the data are shown below the graphs. Statistical comparisons were made with one-way ANOVA followed by Dunnett’s multiple-comparison test. Naive B cells: n = 12; memory B cells: n = 6. *p < 0.05, **p < 0.005, ***p < 0.001, ****p < 0.0001.

