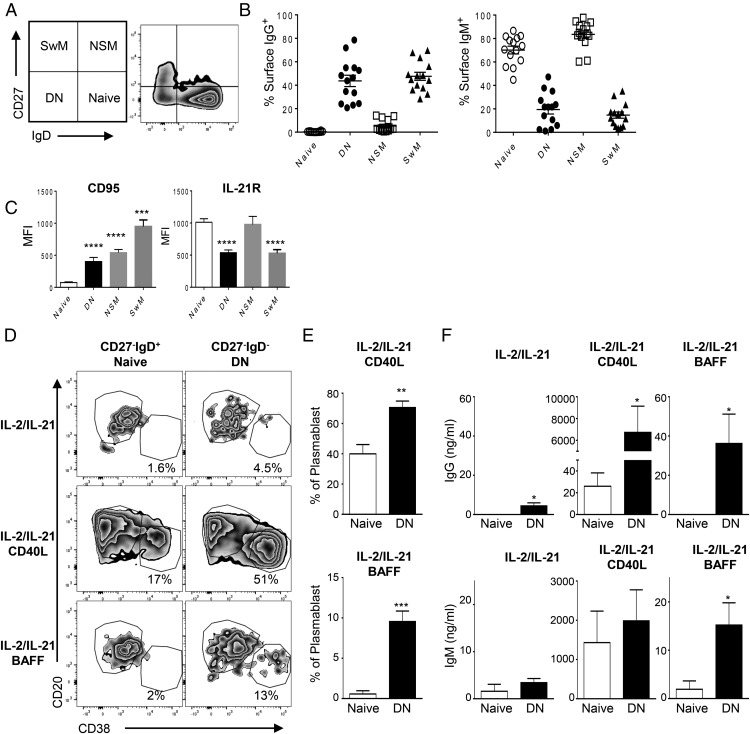
FIGURE 4.
DN B cells display memory phenotype responses to BAFF. Normal PBMCs were analyzed by flow cytometry to assess the difference between naive and DN B cells. (A) Gating scheme and the representative plots for the four subpopulations: DN, naive, SwM, and NSM. (B) Shown are mean percent ± SEM of B cells expressing IgG (left) or IgM (right) in each population (n = 10). (C) Mean fluorescence intensity (MFI) ± SEM of indicated surface molecules is shown. Statistical comparisons were made with one-way ANOVA followed by Dunnett’s multiple-comparison test (n = 10 donors). (D) CD27−IgD+ naive and DN B cells were sorted based on CD27 and IgD expression and cultured with differentiation mixture used in previous experiments for 5 d. Shown are representative plots on day 5. (E) The plasmablast differentiation by IL-2, IL-21, and CD40L (top) or by IL-2, IL-21, and BAFF (bottom) from naive or DN B cells is shown by percent ± SEM in each population. Student t test between naive and DN B cells (n = 5). (F) Culture supernatants were collected on day 5, and IgG and IgM secretion were measured by ELISA. Student t test between naive and DN B cells (n = 5). *p < 0.05, **p < 0.005, ***p < 0.001, ****p < 0.0001.

