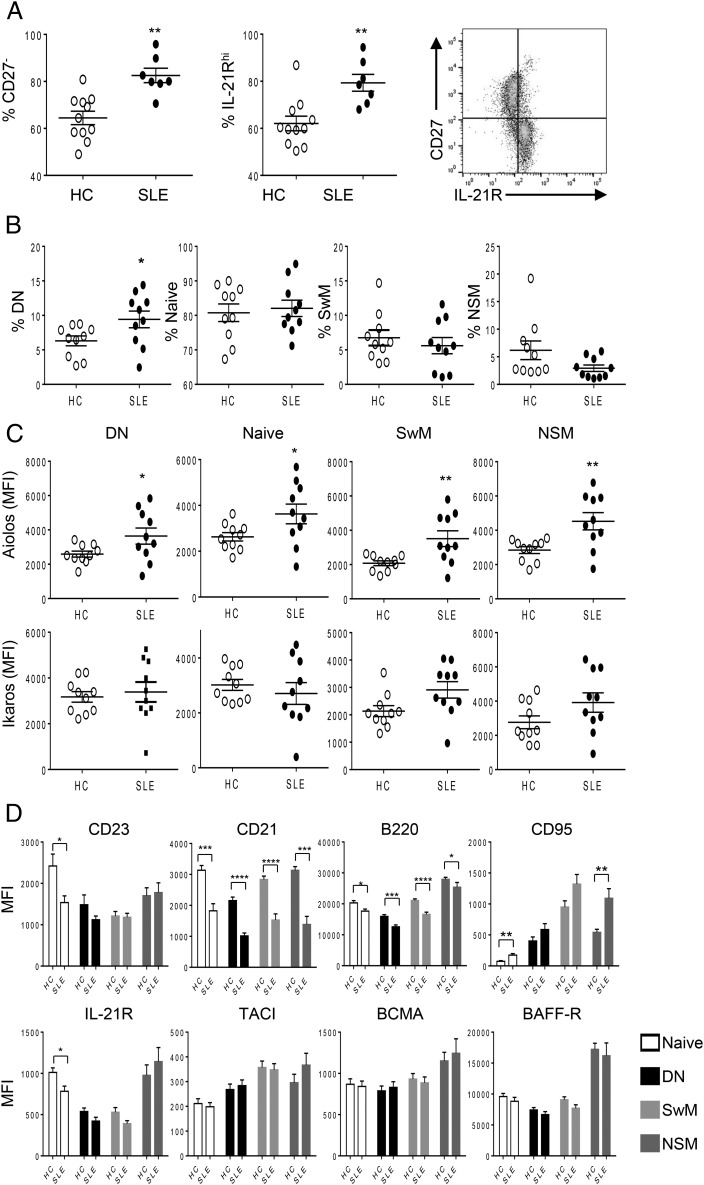
FIGURE 5.
B cell subpopulation alterations and Aiolos overexpression in SLE. (A) PBMCs were isolated from buffy coat of HC and SLE donors, and phenotype was analyzed by flow cytometry. The percent of CD27− B cells (left) and IL-21R+ B cells (middle) among B cells were shown as mean ± SEM. The correlation of CD27 and IL-21R expression is shown as a representative histogram (right). (B) PBMCs from HCs and SLE patients were analyzed by flow cytometry. The mean percent ± SEM of four subpopulations in HC and SLE are shown. (C) Aiolos and Ikaros expression in the indicated B cell subpopulations are shown as mean fluorescence intensity (MFI) ± SEM. (D) Expressions of indicated B cell markers in indicated populations are shown as MFI ± SEM. Student t test between HC and SLE B cells (n = 5): *p < 0.05, **p < 0.005, ***p < 0.001, ****p < 0.0001.

