Figure 7.
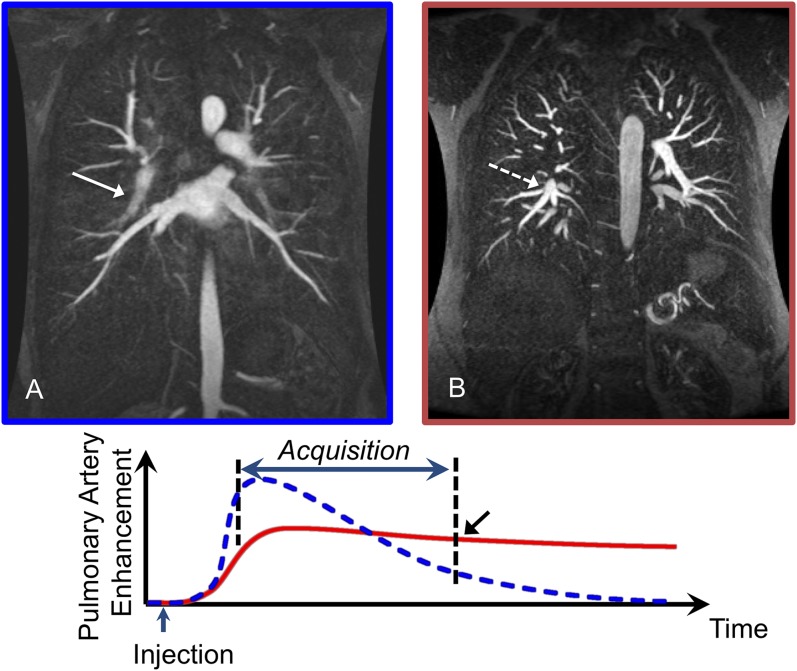
Coronal three-dimensional spoiled gradient recalled echo: the graph demonstrates the different enhancement patterns for a short bolus (dashed curve) compared with a dilute, extended bolus (solid curve). (a) 12 ml of a gadolinium-based contrast agent (GBCA) was injected at a rate of 1.5 ml s−1 for a total duration of 8 s. This bolus of contrast will give an enhancement pattern similar to the dashed curve on the graph with non-uniform enhancement during the acquisition and relatively little enhancement at the end of the acquisition (black arrow) when the edges of k-space are sampled. This results in blurring of the arteries (solid arrow). (b) 12 ml of GBCA diluted with saline to a total volume of 30 ml injected at a rate of 1.5 ml s−1 for a duration of 8 s. The pattern of enhancement corresponds with the solid curve where there is relatively uniform enhancement throughout the acquisition. The edges of k-space are now sampled when there is still adequate enhancement of the pulmonary arteries resulting in sharp arteries (dashed arrow).

