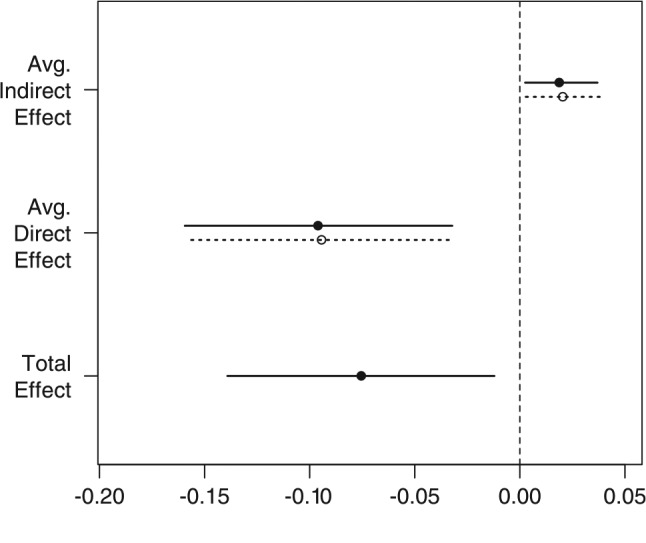
Figure.

Causal mediation analysis using the average indirect effect, average direct effect, and total tffect. Circles represent estimates. Bars represent 95% CI. Filled circles and solid bars represent the Early Head Start group. Open circles and dashed bars represent the Non–Early Head Start group. Avg., average.
