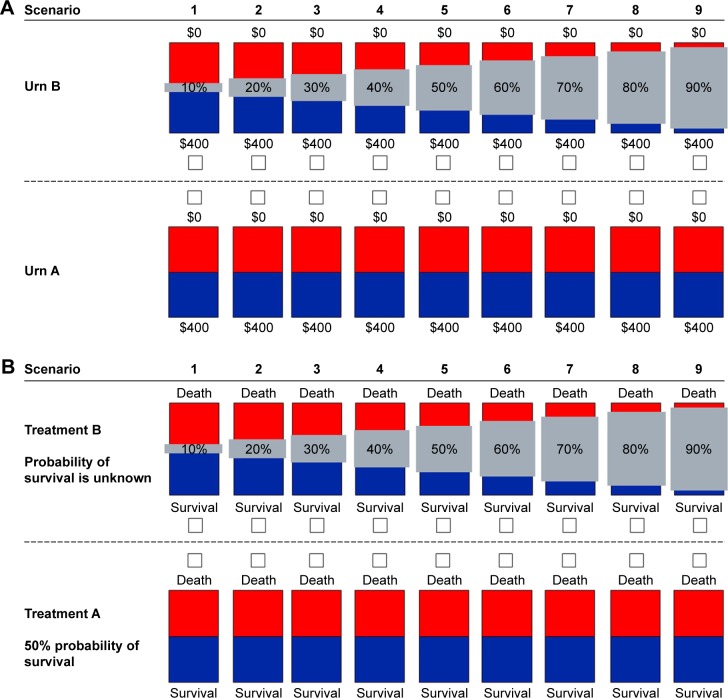
Figure 1.
Aversion to ambiguity in the financial (Panel A) and health (Panel B) domains.
Notes: (A) Representation of the experiment for ambiguity aversion in the financial domain. The amounts are shown in US$. In the administered survey, the family physicians saw the occluders (gray rectangles) without the level (percentage) of uncertainty. Urn A represents a visual option with known 50/50 probability of winning US$400 or US$0. Urn B represents an option with unknown degree of winning probability. (B) Representation of the experiment for ambiguity aversion in the health domain. In this domain also, the family physicians saw the occluders (gray rectangles) without the level of uncertainty in survival.

