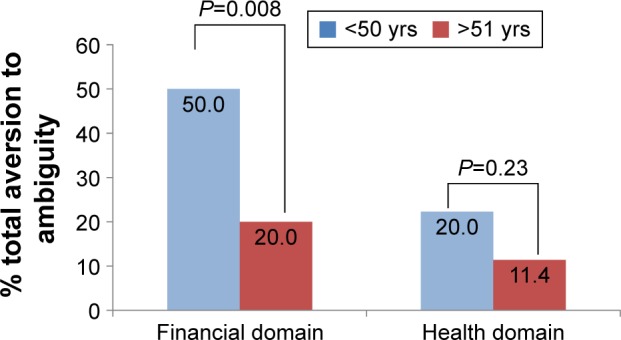
Figure 2.

Prevalence of total aversion to ambiguity by age.
Notes: The figure presents ambiguity aversion by respondent age (median split, in years). In the financial domain, physicians were ambiguity averse if they selected all 50/50, and in the health domain, physicians were ambiguity averse if they selected all treatment with known survival of 20 years and 20% side effects instead of the uncertain probability options.
Abbreviation: yrs, years.
