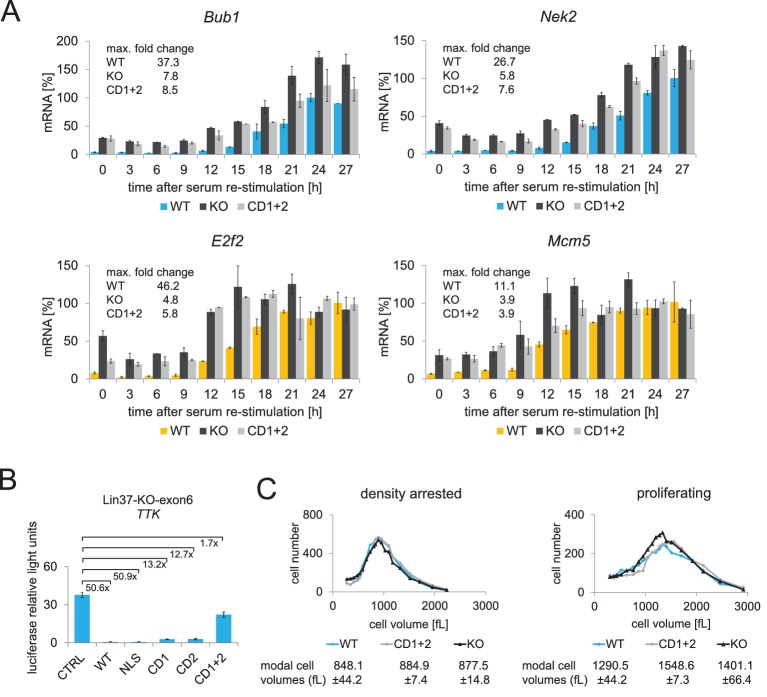
Figure 5. Expression of wild-type Lin37, but not of a MuvB-binding deficient mutant, rescues the knockout phenotype.
(A) Lin37 knockout cells stably transfected with episomal vectors expressing wild-type Lin37 (WT), a MuvB-binding deficient mutant (CD1+2) or luciferase (KO) were arrested by serum starvation in G0 and stimulated to re-enter the cell cycle. mRNA expression of G2/M (blue) and G1/S (yellow) cell cycle genes was measured by qPCR at given time points after serum re-stimulation. All data points for each gene were normalized to the maximum mRNA expression of the Lin37 wild-type rescue cell line which was set to 100%. Mean values ± SD of one representative experiment with two technical replicates for each time point are shown. (B) Activity of the Ttk G2/M cell cycle gene promoter in serum-starved Lin37 knockout cells (clone 632–2) was determined by luciferase reporter assays while expressing wild-type Lin37 (WT), a mutant with non-functional nuclear localization signal (NLS), or mutants with altered MuvB binding domains (CD1, CD2, CD1+2). Mean values ± SD of three biological replicates are given and compared with Ttk promoter activity in Lin37 deficient cells (CTRL). (C) The volumes of density-arrested and proliferating Lin37-deficient cells (clone 632–2) expressing wild-type Lin37 (WT), a MuvB-binding deficient mutant (CD1+2) or luciferase (KO) was determined by Coulter counter analyses. Approximately 30,000 cells were measured in two biological replicates with three technical replicates each. One representative experiment is shown and the modal cell volumes ± SD are given.

