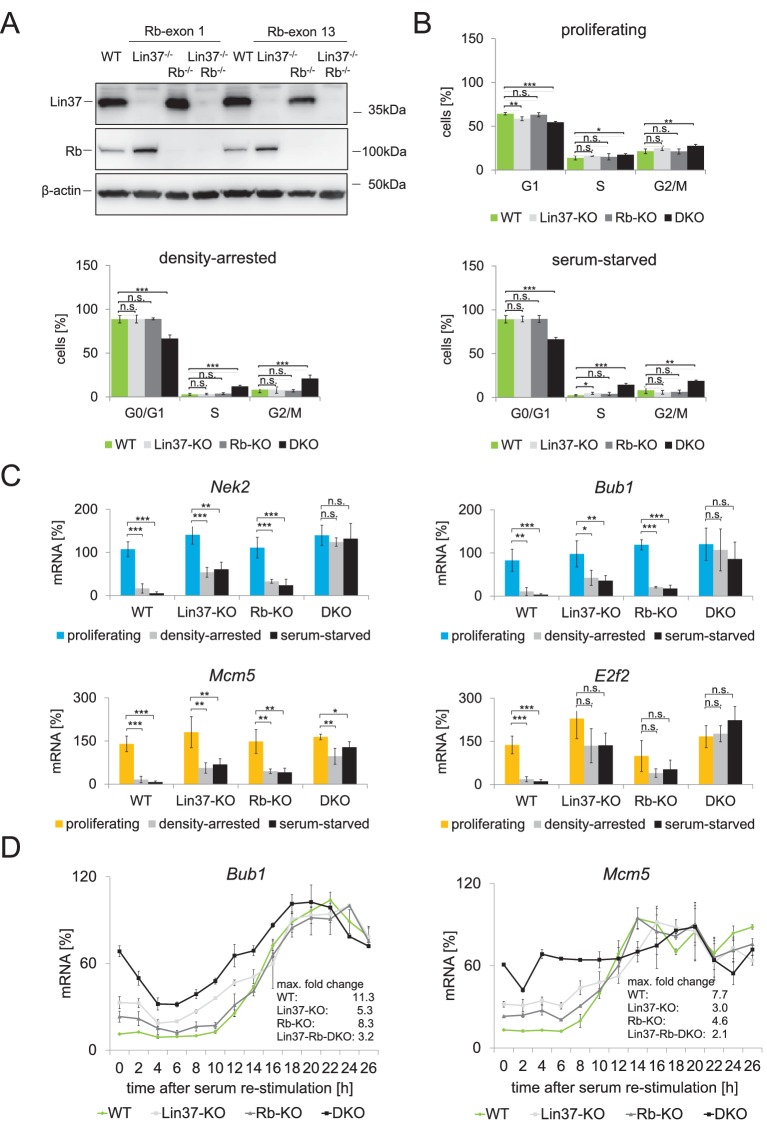
Figure 9. Combined ablation of Lin37 and Rb leads to loss of cell cycle control.
(A) Mutations in the Rb1 gene of NIH3T3 wild-type and Lin37−/− cells were introduced by CRISPR/Cas9 nickase by targeting exon 1 or exon 13. Loss of Rb and Lin37 protein expression was confirmed by Western blot. One representative clone for each targeting approach is shown. (B) Cell cycle distribution of proliferating, density-arrested and serum-starved wild-type (WT), Lin37−/− (Lin37-KO), Rb−/− (Rb-KO), and Lin37−/−/Rb−/− (Lin37-Rb-DKO) cell lines was analyzed by DNA-PI staining. Percentage of cells in G0/G1, S, and G2/M cell cycle phases and mean values ± SD of 4 independent cell lines each are given. Significances were calculated by the Students T-Test. (*p≤0.05, **p≤0.01, ***p≤0.001). (C) Expression of G2/M (Nek2, Bub1) and G1/S (Mcm5, E2f2) genes in the same cell lines was analyzed by qPCR. For each gene, mRNA levels were normalized to the expression of proliferating wild-type cells which were set to 100% and mean values ± SD are shown. (D) Wild-type (WT), Lin37−/− (Lin37-KO), Rb−/− (Rb-KO), and Lin37−/−/Rb−/− (DKO) cell lines were arrest by serum starvation in G0 and stimulated to re-enter the cell cycle. mRNA expression of late (Bub1) and early (Mcm5) cell cycle genes was measured by qPCR at given time points after serum re-stimulation. Mean values ± SD of one representative experiment with two technical replicates for each time point are shown. All data points for each gene were normalized to the maximum mRNA expression of the Lin37 wild-type cell line which was set to 100%. See Figure 9—source data 1 for cell cycle analysis.

