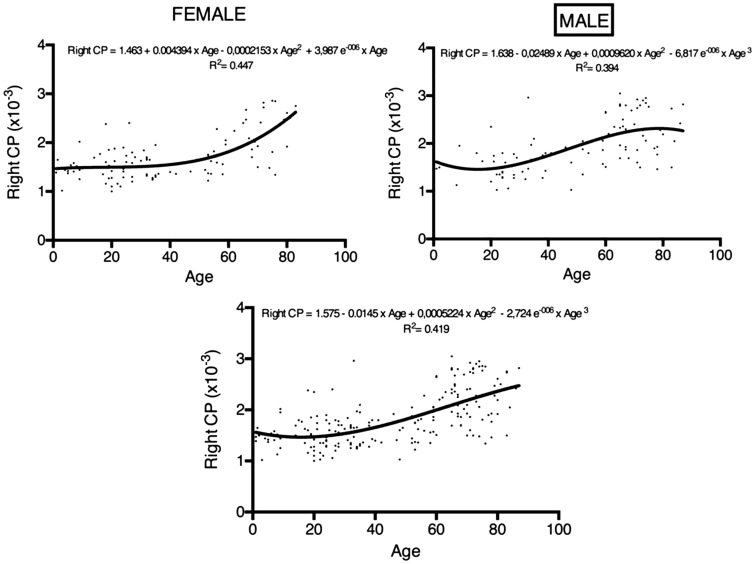
Figure 3.
Regression analysis displaying the trends of age-related ADC values of CPs (right, left and overall) separately in women and in men. Vertical axis is ADC value of right, left and all CP. Horizontal axis is age. Regression equation is given on each graph.
ADC: apparent diffusion coefficient; CPs: choroid plexuses.

