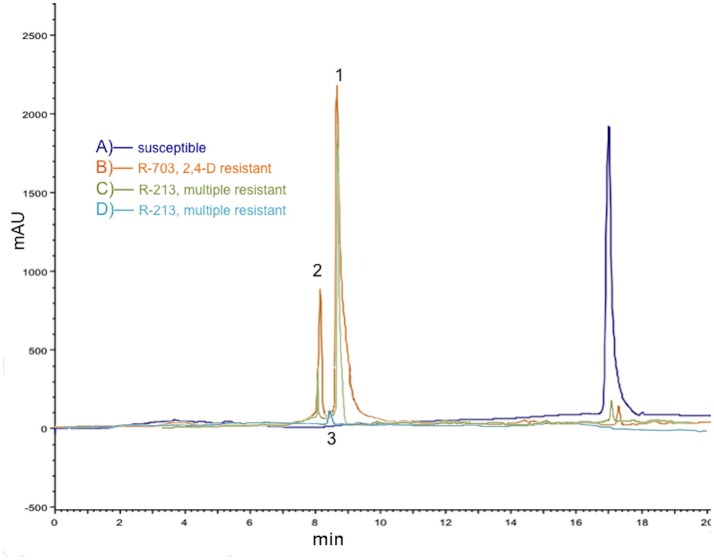
Figure 1.
Comparison of 2,4-D metabolism in three Papaver rhoeas populations in 2,4-D treated plants (2,400 g ai./ha after 168 HAT). (A) Representative HPLC chromatogram of extract (second partition) from S plants in purple; only 2,4-D was detected. (B) Representative HPLC chromatogram of extract (second partition) from only 2,4-D R plants (population R-703) in orange; 2,4-D and two metabolites, 2,3-D (1) and 2,5-D (2) were detected. (C) Representative HPLC chromatogram of extract (second partition) from multiple R plants (population R-213) in green; 2,4-D and two metabolites, 2,3-D (1) and 2,5-D (2) were detected. (D) Representative HPLC chromatogram of extract (third partition into ether phase) from multiple R plants in blue; a sugar conjugated compound (3) was detected. Representative HPLC chromatograms from three independent experiments are shown.

