Figure 7.

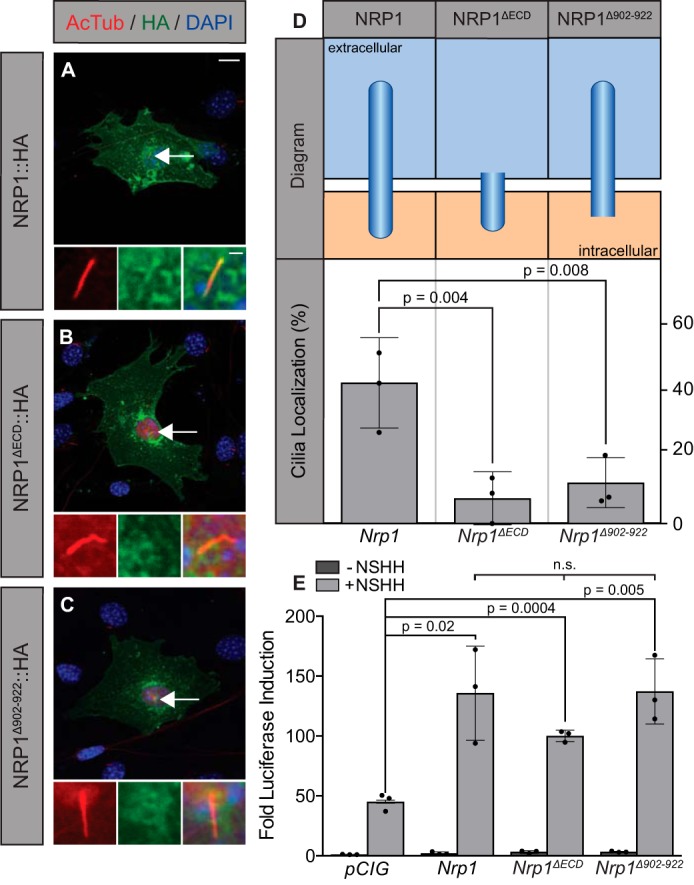
Ciliary localization of NRP1 does not correlate with HH signal promotion. A–C, antibody detection of NRP1 (A), NRP1ΔECD (B), and NRP1Δ902–922 (C) in NIH-3T3 cells (HA, green; AcTub, red; DAPI, blue). D, chart summarizing the structure (top) and cilium localization (bottom) of each construct imaged on the left. n = 165, 166, and 162 cells for Nrp1, NRP1ΔECD, and NRP1Δ902–922, respectively. Scatterplot values indicate averages of three independent experiments, with column height indicating the overall average ± S.D. E, luciferase reporter activity in NIH-3T3 cells transfected with constructs as indicated and stimulated with NSHH-conditioned medium (+NSHH). Data are reported as mean -fold induction ± S.D., with p values calculated using two-tailed Student's t tests. n.s., not significant. Scale bar = 10 μm, inset scale bar = 1 μm.
