Figure 1.
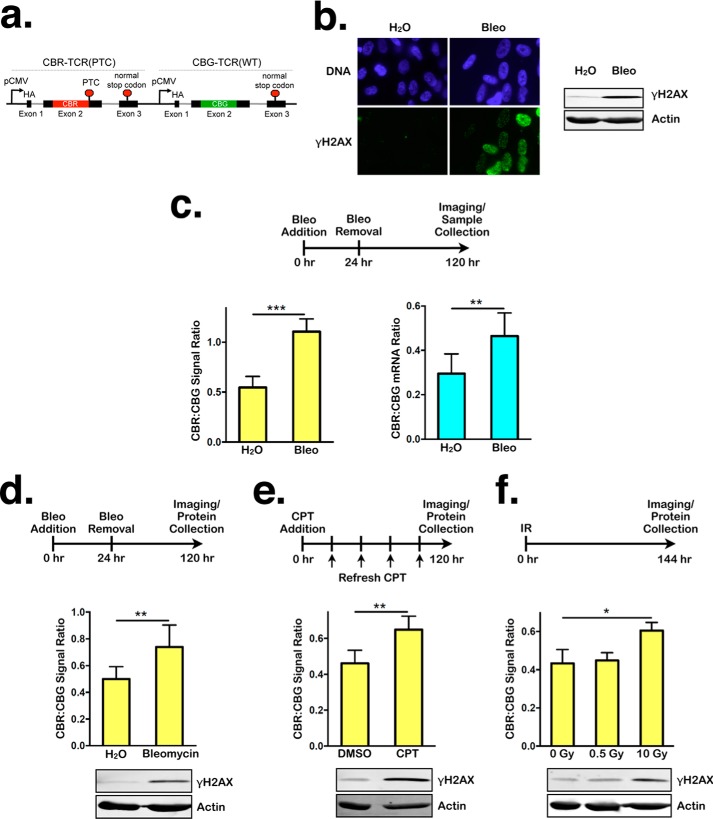
Persistent DNA damage inhibits NMD. a, schematic of a dual-color bioluminescence-based reporter for measuring NMD activity in human cells. b, left panel, representative images of immunofluorescence staining for DAPI or γH2AX in RPE1 cells after 24-h treatment with either H2O or bleomycin (Bleo), followed by 96-h recovery. Right panel, Western blot showing γH2AX levels in lysates collected after 24-h treatment with either H2O or bleomycin, followed by 96-h recovery. c, left panel, ratios of CBR:CBG bioluminescence signals in RPE1 cells expressing the NMD reporter (hereafter referred to as RPE1 reporter cells for simplicity) after 24-h treatment with either H2O or bleomycin, followed by 96-h recovery. Data represent the mean ± S.D. of four independent experiments. ***, p ≤ 0.001 (paired t test). Right panel, ratios of CBR-TCR(PTC):CBG-TCR(WT) mRNA expression in RPE1 reporter cells after 24-h treatment with either H2O or bleomycin, followed by 96-h recovery. Data represent the mean ± S.D. of four independent experiments. **, p ≤ 0.01 (paired t test). d, ratios of CBR:CBG bioluminescence signals (top panel) and γH2AX levels (bottom panel) in BJ fibroblasts expressing the NMD reporter after 24-h treatment with either H2O or bleomycin, followed by 96-h recovery. Data represent the mean ± S.D. of three independent experiments. **, p ≤ 0.01 (paired t test). e, ratios of CBR:CBG bioluminescence signals (top panel) and γH2AX levels (bottom panel) in RPE1 reporter cells after 120-h treatment with either DMSO or 60 nm CPT. Data represent the mean ± S.D. of four independent experiments. **, p ≤ 0.01 (paired t test). f, ratios of CBR:CBG bioluminescence signals (top panel) and γH2AX levels (bottom panel) in RPE1 reporter cells 144 h after exposure to 0 Gy, 0.5 Gy, or 10 Gy of ionizing radiation (IR). Data represent the mean ± S.D. of three independent experiments. *, p ≤ 0.05 (paired t test).

