Figure 4.
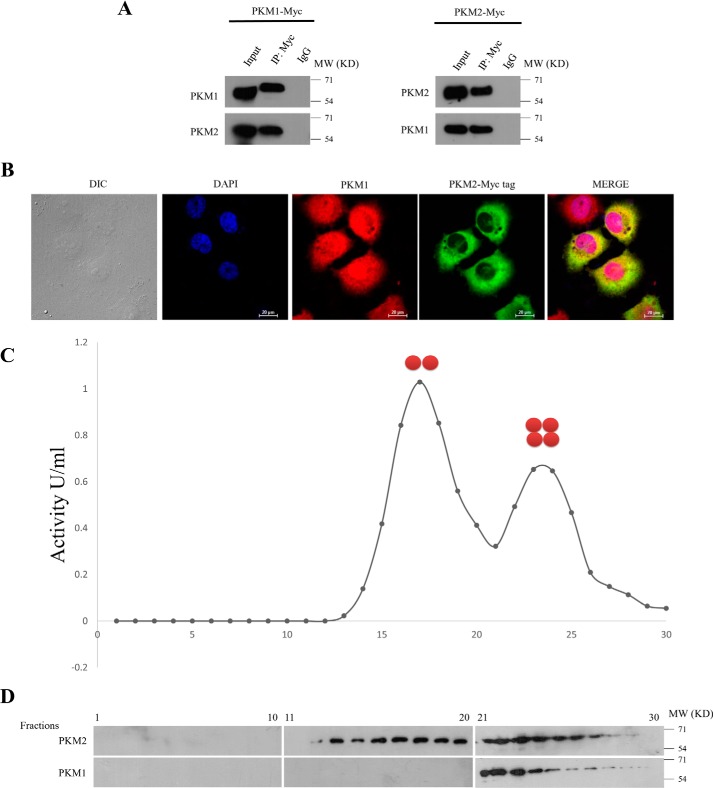
PKM1 and PKM2 interact with each other. A, immunoprecipitation (IP) performed with anti-Myc-tag in lysates of H1299 cells, stably expressing Myc-tagged PKM1 (PKM1-Myc) (left panel), or Myc-tagged PKM2 (PKM2-Myc) (right panel), followed by immunoblotting with PKM1 or PKM2 antibodies, to show the interaction between PKM-isoforms (IgG used as isotype control). B, confocal microscopy images, displaying the co-localization of endogenous PKM1 (immunostained with anti-PKM1 and secondary anti-Alexa Fluor 589 red) and exogenously expressed Myc-tagged PKM2 (immunostained with anti-Myc-tag and secondary anti-Alexa Fluor 488 green) in H1299 cells. Nucleus was stained with DAPI (blue); figures are shown with a scale bar of 20 μm. C, dimeric and tetrameric peaks of PKM, resolved by examining pyruvate kinase activity from the fractions collected after glycerol density gradient ultracentrifugation, loaded with protein lysates from H1299 cells. D, immunoblotting with anti-PKM1 and anti-PKM2 of the glycerol density gradient fractions as mentioned in C to measure the distribution of PKM1 and PKM2 in the separated peaks in C.

