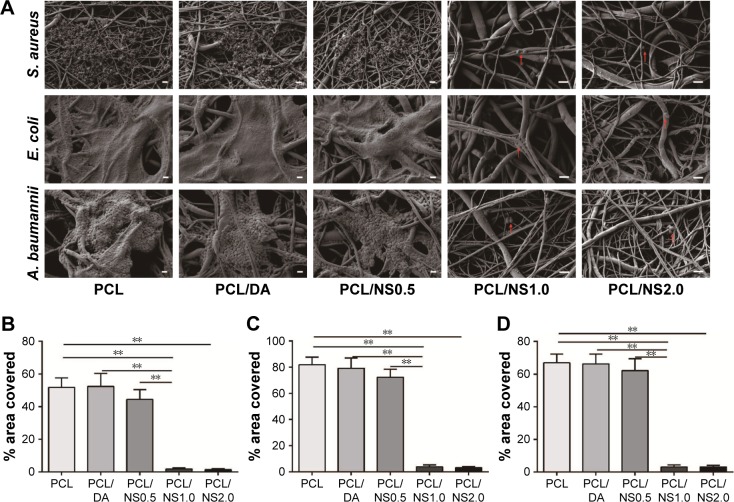
Figure 6.
The effect of PCL/NS on the formation of biofilms.
Notes: (A) SEM morphology of biofilms on the surfaces of PCL, PCL/DA, PCL/NS0.5, PCL/NS1.0 and PCL/NS2.0; the red arrows indicate the adherent bacteria. The quantitative area covered by the biofilms of (B) S. aureus, (C) E. coli and (D) A. baumannii. Scale bars: 1 µm. Magnification of images in PCL, PCL/DA and PCL/NS0.5 groups are ×3,000, and the magnification of images in PCL/NS1.0 and PCL/NS2.0 groups are ×5,000. **p<0.01.
Abbreviations: A. baumannii, Acinetobacter baumannii; DA, dopamine; E. coli, Escherichia coli; NS, nanosilver; PCL, polycaprolactone; S. aureus, Staphylococcus aureus; SEM, scanning electron microscopy.

