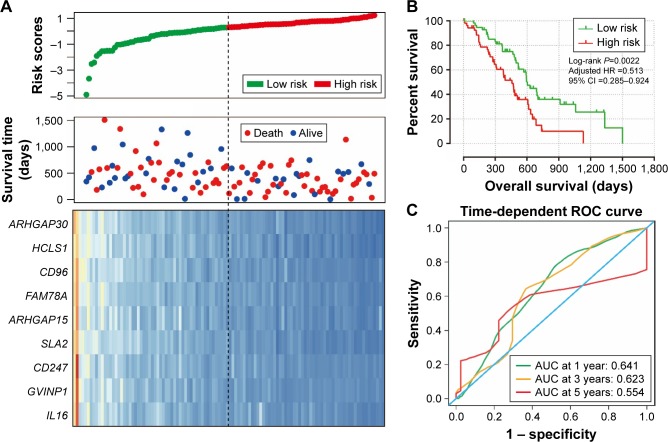
Figure 7.
Prognostic risk score model analysis of nine hub genes in PDAC patients.
Notes: (A) From top to bottom are the risk score, patients’ survival status distribution, and nine hub genes expression heat map for low- and high-risk groups. (B) Kaplan–Meier curves for low- and high-risk groups. (C) ROC curve for predicting survival in PDAC patients by the risk score.
Abbreviations: ARHGAP30, Rho GTPase activating protein 30; HCLS1, hematopoietic cell-specific Lyn substrate 1; CD96, CD96 molecule; FAM78A, family with sequence similarity 78 member A; ARHGAP15, Rho GTPase activating protein 15; SLA2, Src like adaptor 2; CD247, CD247 molecule; GVINP1, GTPase, very large interferon inducible pseudogene 1; IL16, interleukin 16; ROC, receiver operating characteristic; PDAC, pancreatic ductal adenocarcinoma.

