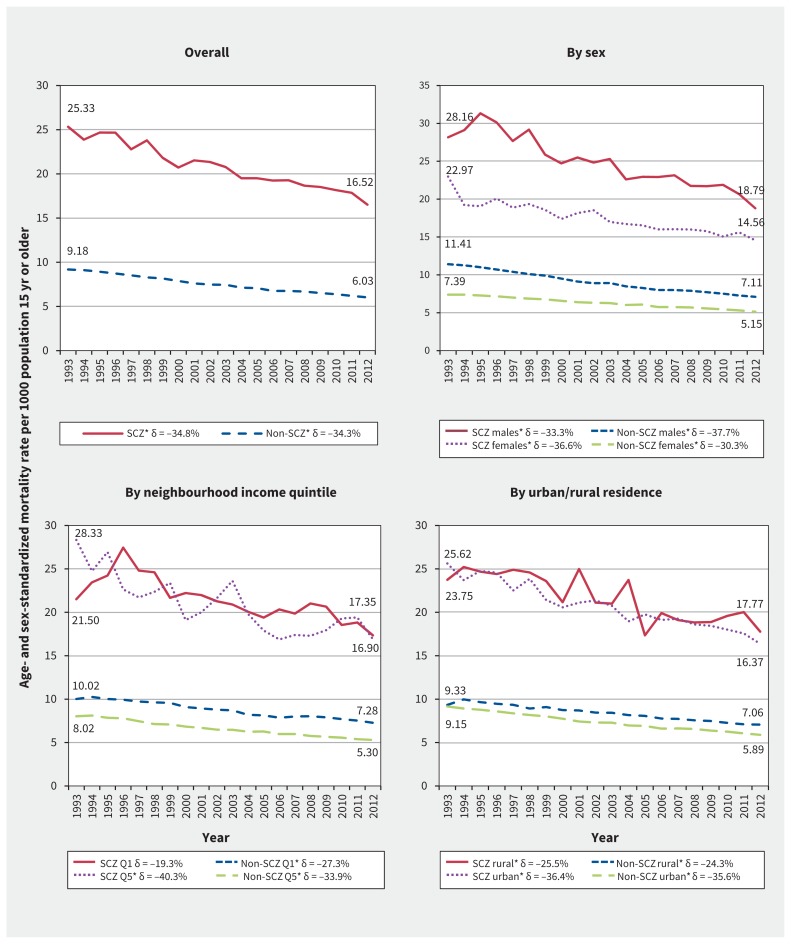
Figure 1:
Temporal trends in all-cause age- and sex-standardized mortality rates in individuals with and without schizophrenia (SCZ) overall, by sex, by income quintile (where Q1 = lowest and Q5 = highest) and by rural or urban residence. Trends were examined using unadjusted linear regression models, and significant (p < 0.05) trends between 1993 and 2012 are indicated by an asterisk. Delta (δ) values indicate the relative differences between 1993 and 2012 rates, expressed as a percentage of the 1993 rate; for absolute differences, see Appendix 2, available at www.cmaj.ca/lookup/suppl/doi:10.1503/cmaj.161351/-/DC1). Mortality rates were age- and sex-standardized to the 2006 Ontario population using the direct method. For each trend line, the 1993 and 2012 data points are noted explicitly within the graph.

