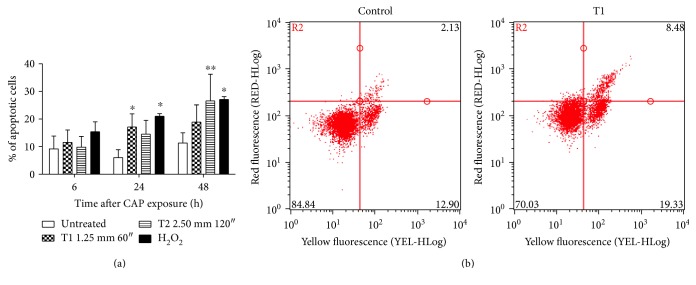
Figure 2.
(a) % of apoptotic cells 6, 24, and 48 h after CAP treatment of Jurkat cells under T1 (1.25 mm 60″) and T2 (2.50 mm 120″) conditions (mean of three different experiments). H2O2 300 μM was used as positive control. (b) Representative dot plot of annexin V (yellow fluorescence) versus 7-amino-actinomycin D (7AAD, red fluorescence) for the untreated cells and cells 24 h after CAP treatment under T1 condition. ∗P < 0.05; ∗∗P < 0.01 versus the untreated cells.

