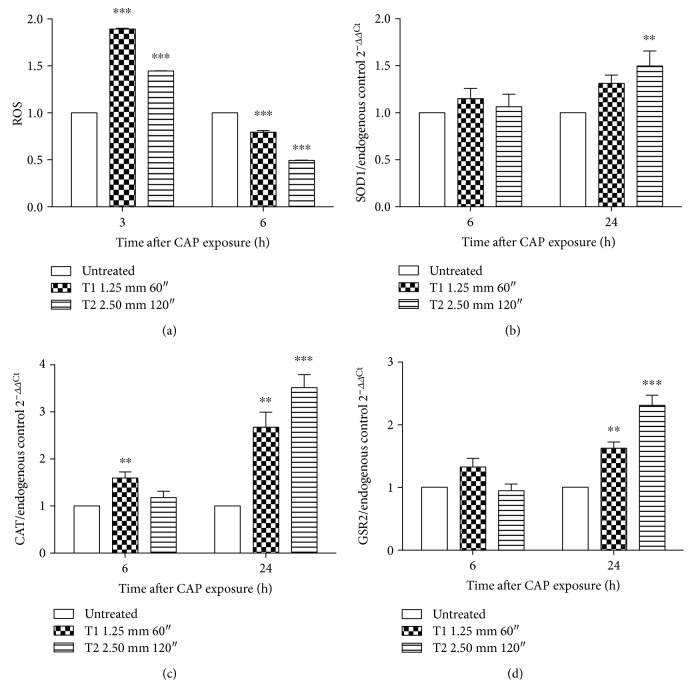
Figure 4.
Effect of CAP on ROS levels and antioxidant enzymes. (a) Intracellular levels of ROS in Jurkat cells after CAP exposure for 3 and 6 h, measured via 2′,7′-diclorofluorescein (DCF) fluorescence. Relative mRNA expression of (b) SOD1, (c) CAT, and (d) GSR2 6 and 24 h after CAP treatment. 18S ribosomal RNA and actin beta (ACTB) were used as endogenous controls. Data are the mean of three different experiments. ∗∗P < 0.01; ∗∗∗P < 0.001 versus the untreated cells.

