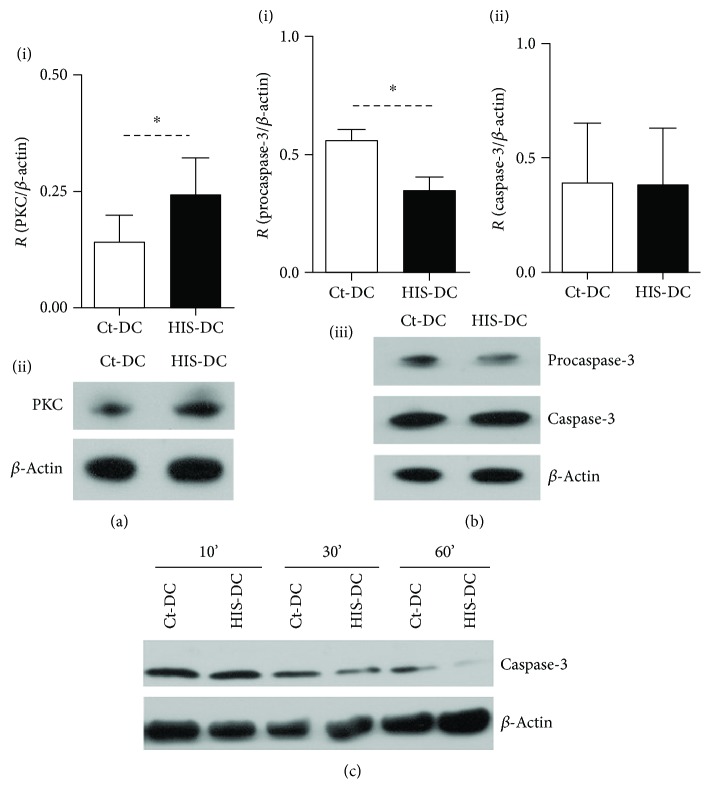
Figure 6.
Histamine modulates PKC and caspase activation. (a), (i) Bars represent the mean ± SE of 8 experiments (∗p < 0.05, Student's t-test). (a), (ii) A representative Western blot of PKC is shown. In (b), (i) and (ii), we show the quantification of procaspase-3 and caspase-3, respectively. Bars represent the mean ratio ± SE of 5 experiments, ∗p < 0.05, Student's t-test. (b), (iii) We show a representative gel for procaspase-3 and cleaved caspase-3. (c) Analysis of cleaved caspase-3 at different time points was performed. We show one representative blot.

