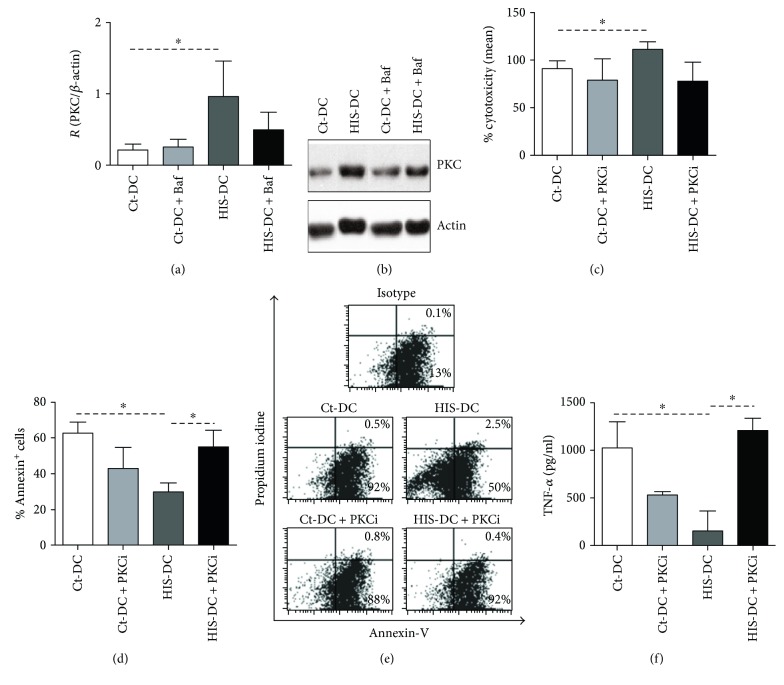
Figure 8.
PKC modulates the apoptosis of DC stimulated by HIS. DC were treated with or without Baf (0.1 μM). After 90 min, DC were stimulated or not with HIS (0.1 μM). In (a), bars represent the quantification of PKC as the mean ± SE of 5 obtained from Western blot experiments, p < 0.05, ANOVA and Tukey's test. In (b), a representative gel is shown. (c) Histograms show the cytotoxicity after 48 h of in vitro coculture of OVA-immunized splenic mononuclear cells (5 × 10⁵) with OVA loaded-DC stimulated or not with HIS (1.25 × 10⁵). Bars represent the mean of cytotoxicity percentage ± SE of 6 independent experiments. p < 0.05, ANOVA, and Tukey's test. In figure (d), after inhibition of PKC pathway, HIS-stimulated DC were exposed to 42°C. Finally, apoptosis was analyzed 24 h later by flow cytometry. In (d), bars represent the mean ± SE, n = 5 (p < 0.05, ANOVA Tukey's test). In (e), a representative dot plot is shown with Annexin-V and propidium iodide. (f) TNF-α production in DC cultures was analyzed in the supernatants of apoptotic cells at 24 h by ELISA. The bars represent the mean ± SEM of 4 experiments. The figure shows mean concentration values (pg/ml). Asterisks indicate statistical significance (∗p < 0.05, ANOVA and Tukey's posttest).

