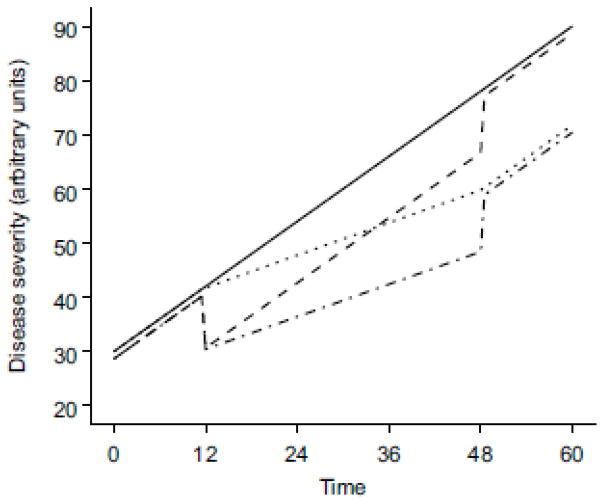
Fig. 1.
A hypothetical empirical disease model with linear progression. The solid line represents disease progression with no treatment, and the other lines represent disease progression with treatment effects that start at time 12 and end at time 48. The dashed line illustrates the effect of a drug that provides symptomatic relief; the dotted line illustrates the effect of a drug that modifies the rate of disease progression; and the dotted-and-dashed line illustrates the combined effects of a disease-modifying drug that also provides symptomatic relief. Note that the lines have been offset slightly to prevent overlap

