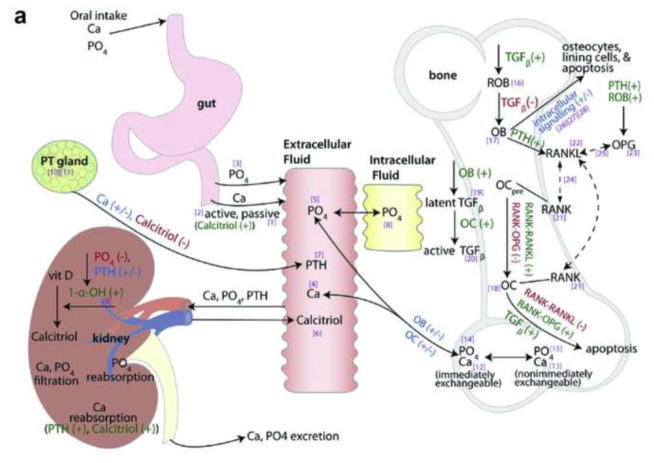
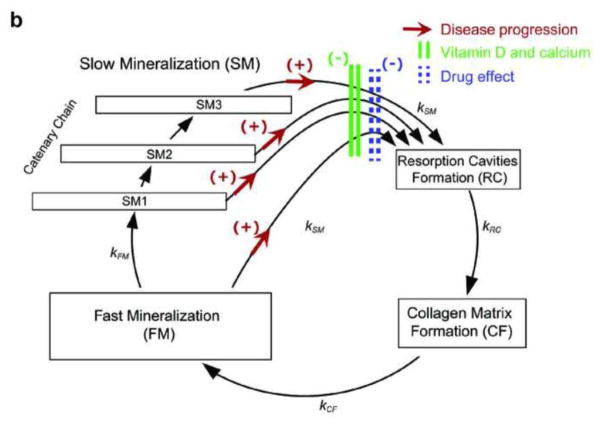
Fig. 2.
a Schematic representation of the systems-based model describing calcium homeostasis and bone remodeling. Solid arrows indicate fluxes, dashed arrows indicate binding effects, dark green plus signs indicate stimulatory effects, red minus signs indicate inhibitory effects, blue plus/minus signs indicate bidirectional effects, and bracketed purple numbers refer to differential equation numbers in the source publication. (Reprinted with permission of Elsevier from [40], copyright 2009) b Schematic representation of the semi-mechanistic bone cycle model. The red arrows between the mineralization and resorption compartments indicate an increased transit rate due to disease progression; the green bars indicate a decreased transit rate due to vitamin D and calcium supplementation; and the dashed blue bars indicate a decreased transit rate due to a drug effect. (Reprinted with permission of Springer from [19], copyright Springer Science+Business Media New York 2015) 1-α-OH 1-alpha-hydroxylase, Ca calcium, OB osteoblast, OC osteoclast, OCpre osteoclast precursor, OPG osteoprotegerin, PO4 phosphate, PT gland parathyroid gland, PTH parathyroid hormone, RANK receptor activator of nuclear factor kappa B, RANKL RANK ligand, ROB responding osteoblast, TGFβ transforming growth factor beta, vit D vitamin D


