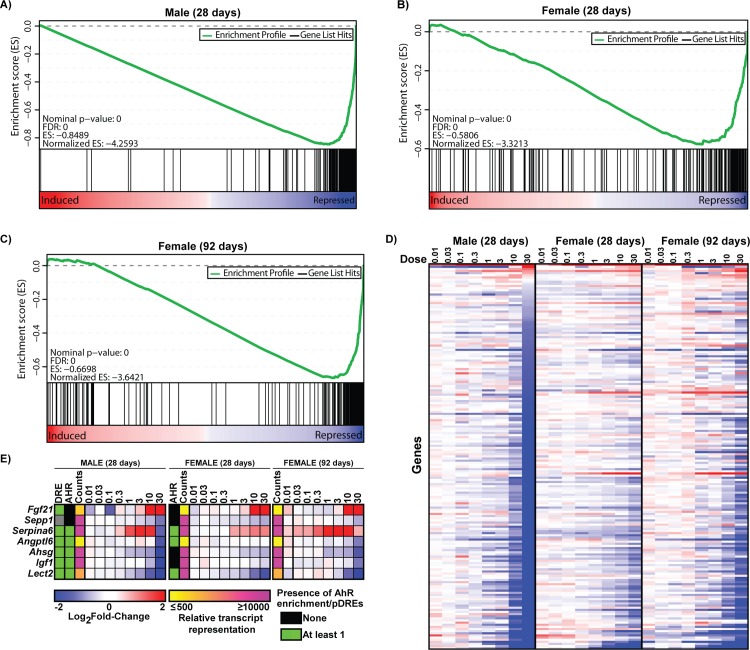
Fig 1. Gene expression changes of liver related genes.
Gene set enrichment analysis (GSEA) of 181 liver specific-genes in (A) male and (B) female mice gavaged with 30 μg/kg TCDD every 4 days for 28 days, or (C) female mice gavaged with 30 μg/kg TCDD every 4 days for 92 days. The 181 liver-specific genes were identified using published microarray datasets representing 96 tissues/cell types [34]. Identification of liver-specific genes is described in materials and methods. TCDD elicited gene expression changes were ranked from most induced (left—red) to most repressed (right). Vertical black line represents identified liver-specific genes. The top panel (green line) represents a running-sum statistic (enrichment score) based on the lower panel, increasing when a gene is a member of the liver-specific gene set and decreasing when it is not. Enrichment scores increased most dramatically on the right indicating most of the liver-specific genes were repressed by TCDD. (D) Heat map of liver-specific gene expression changes elicited by TCDD. (E) Heatmap of TCDD-elicited repression of hepatokines. For heatmaps (D and E) blue indicates repression while red represents induction. The presence of pDREs (MSS ≥ 0.856) and hepatic AhR enrichment peaks (FDR ≤ 0.05) at 2h are shown as green boxes. Read count represents the maximum raw number of aligned reads to each transcript where yellow represents a lower level of expression (≤ 500 reads) and pink represents a higher level of expression (≥ 10,000).

