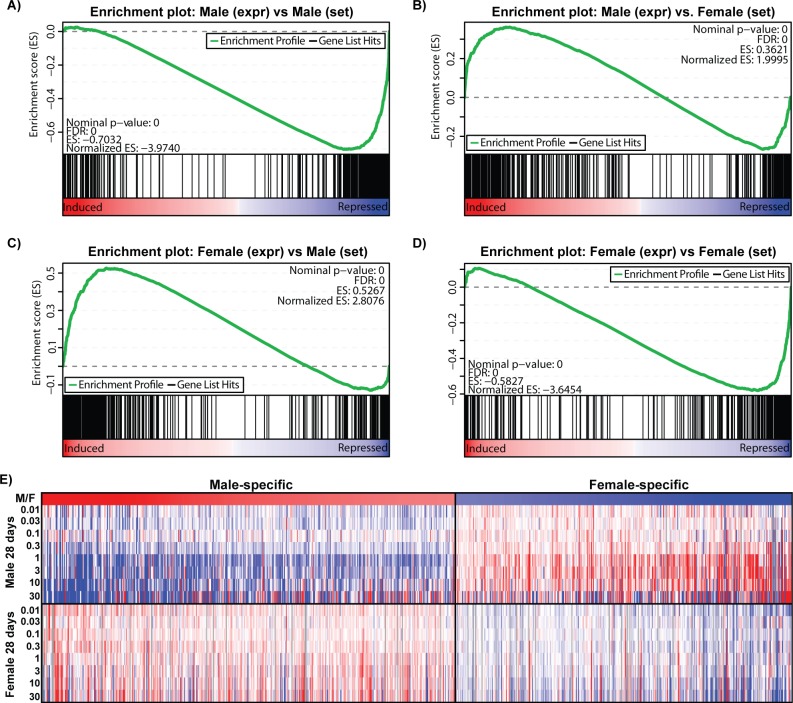
Fig 7. Gene expression changes of sexually dimorphic genes.
Gene set enrichment analysis (GSEA) of sexually dimorphic genes in (A-B) male and (B-C) female mice gavaged with TCDD every 4 days for 28 days. GSEA was performed using male-enriched and female-enriched gene sets determined as described in materials and methods. Gene expression changes were ranked from largest positive to largest negative. The top panel (green line) represents a ‘running-sum statistic’ which increases when a gene is in a gene set (denoted by black bars), and decreasing when it is not. TCDD repressed the majority of male-specific dimorphic genes (A) while inducing many female-specific genes (B) in male mice. Conversely, TCDD induced many male-specific genes (C) while repressing a majority of the female-specific genes (D) in female mice. (E) Heat map demonstrates the gene expression changes in male-specific and female-specific genes at 28 days.

