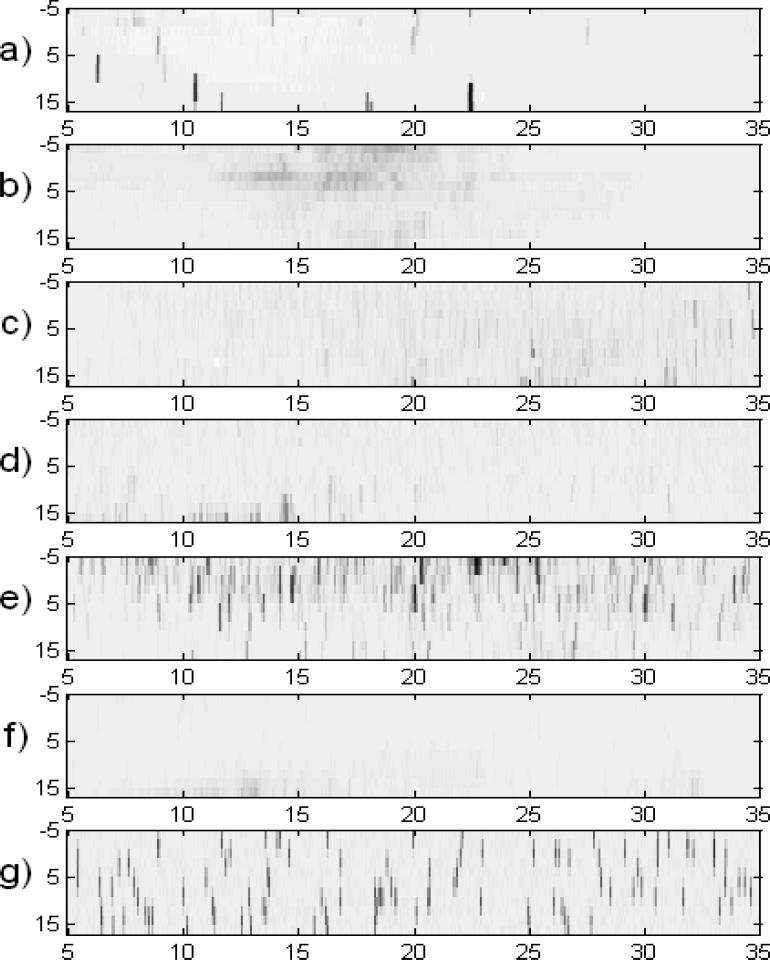
Fig. 3.
Diffraction intensity maps in angular coordinates. A comparison of frozen specimens of (a) water, (b) 41 % (w/w) trehalose, (c) 10 % (w/w) DMSO, (d) 10 % (w/w) DMSO + 3.2 % (w/w) trehalose, (e) 0.05 % (w/w) AFP, (f) 1 % (w/w) AFP, (g) simulated peaks. Horizontal axis, angle ω (horizontal tilt); vertical axis, angle χ (vertical inclination); the grey scale is logarithmic and is the same for all plots.

