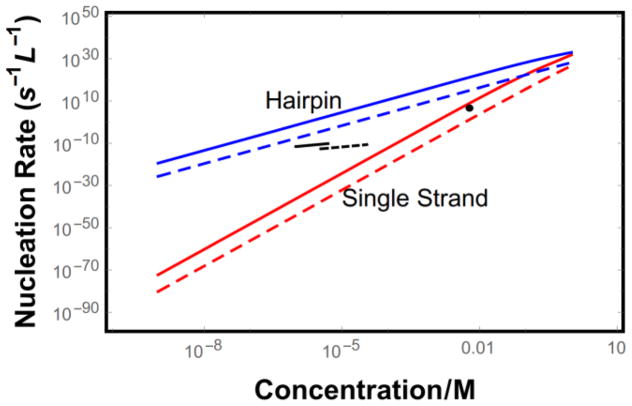
Figure 5.
Predicted nucleation rate for hairpin molecules with L = 40 (blue) and single strand molecules with L = 15 (red). Long dashes represent the case where binding registry is strictly enforced, while solid lines show promiscuous binding. Short black lines show experimentally determined nucleation rates (data were used to fit the proportionality constant and exponent for knuc ∝ cx) for Aβ42 (solid)[54] and Aβ40 (dashed)[55]. The single black dot shows the nucleation rate for insulin[56].

