Figure 5.
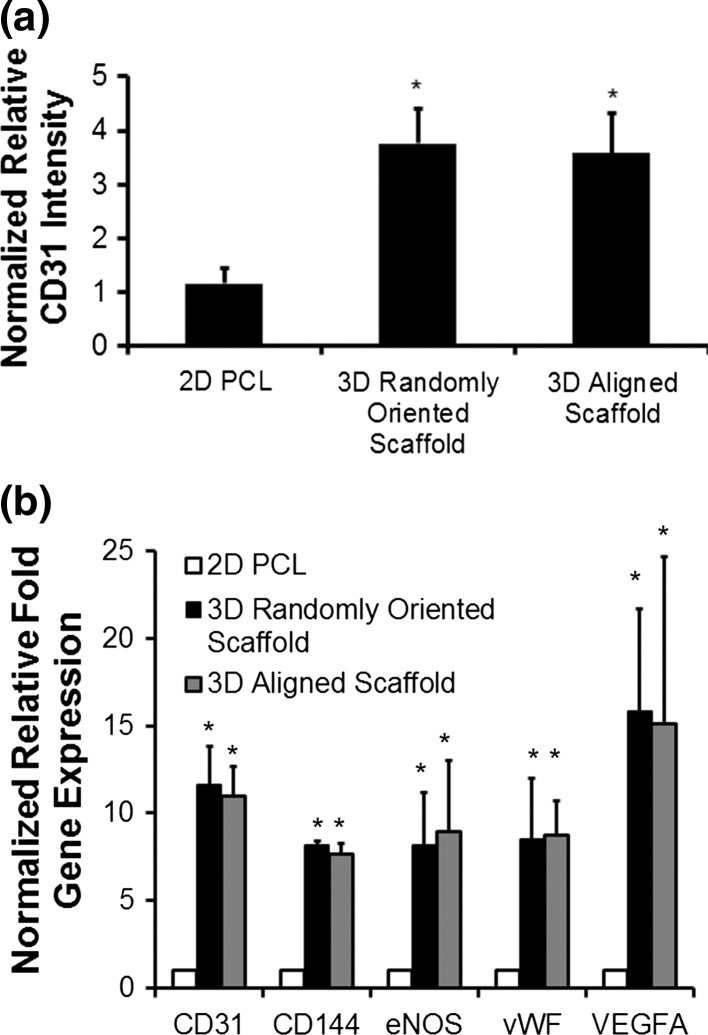
Quantification of endothelial differentiation after 5 days of differentiation. (a) Comparison of normalized relative CD31 intensity between 2D PCL and 3D randomly oriented or aligned scaffolds (n = 3); (b) Normalized relative fold change in gene expression for endothelial-related genes (n = 3). * indicates p < 0.05 (n = 3).

