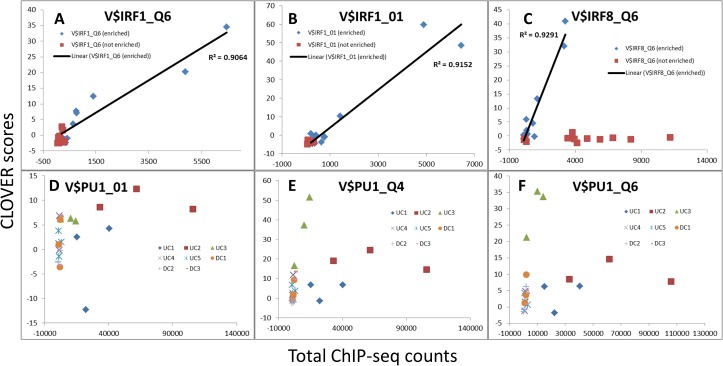
Fig 6. Correlation between Clover scores and observed TF binding.
Plots show relationship between Clover scores (y axes) and ChIP-seq counts (x axes) for motifs for IRF1 (V$IRF1), IRF8 (V$IRF8) and PU.1/SPI1 (V$PU1) for all eight clusters at 0, 2 and 4 h time points. Panes A-C show Clover scores and observed counts for enriched motifs (blue diamonds), correlation for those (black line) and Clover scores and counts for motifs that are not enriched (red squares). Panes D-F show Clover scores and ChIP-seq counts for the SPI1 motif separately for each cluster (three time points for each cluster).

