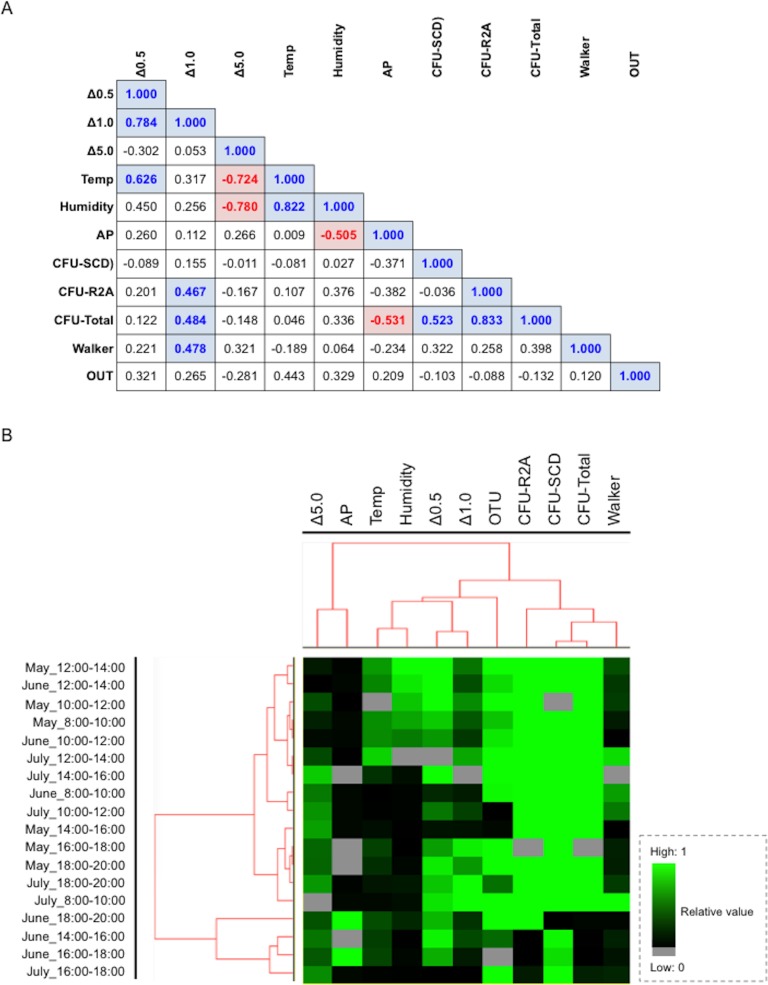
Fig 6. Comparison of Pearson's correlation coefficient among factors and phylum types in the underground pedestrian space.
(A) Matrix showing comparison of Pearson's correlation coefficient among factors. Values show the correlation coefficient. Bold values showing positive and negative correlation with colors indicate statistical significance (a correlation coefficient value of >0.5 or <−0.05 with a p-value < 0.05). (B) Clustering of the phylum type consisting of distinct factors. All values of the factors with distinct ranges were adjusted to an equivalent range from “0” to “1”. Factors include Δ0.5 (particle size: 0.3–0.5μm), Δ1.0 (particle size: 0.5–1.0μm), Δ5.0 (particle size: 1.0–5.0μm), Temp (temperature: °C), Humidity (%), AP (atmospheric pressures: hpa), CFU-SCD (CFU numbers per m3 estimated by SCD plate culture), CFU-R2A (CFU numbers per m3 estimated by R2A plate culture), CFU-Total (total CFU numbers per m3 estimated by SCD and R2A plate cultures), Walker (walker numbers per 10 min) and OTU (OTU numbers estimated by 16S rDNA sequence analysis and BLAST search). These data were similarly processed with a setting (>80% filtering and Spearman rank correlation). After replaced to the files with a ‘cdt’ extension in the software of Cluster 3.0 for visualizing on the TreeViewX.

