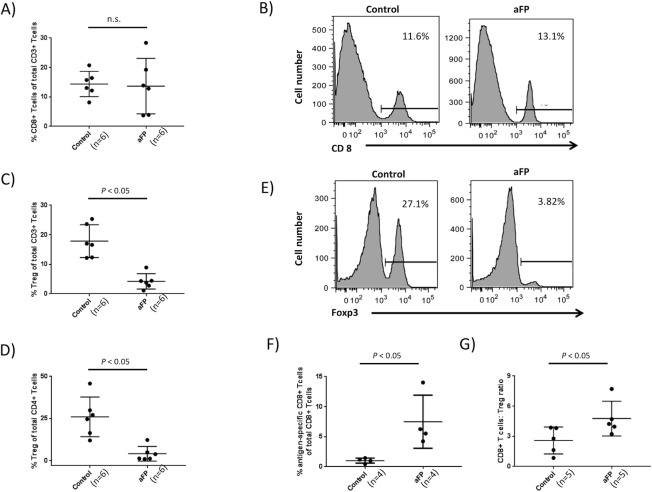
Fig 6. Flow cytometric analysis for tumor infiltrating lymphocytes.
(A) proportion of CD8+ T lymphocytes compared with CD3+ T lymphocytes in the tumor. (B) representative images of flow cytometry for CD8+ T lymphocytes on day 5 after aFP in the control group and aFP group respectively. The number in the figures represents proportion of CD8+ T lymphocytes compared with CD3+ T lymphocytes. (C and D) proportion of Treg compared with CD3 and CD4+ T lymphocytes in the tumor respectively. (E) representative images of flow cytometry for Treg on day 5 after aFP in the control group and aFP group respectively. The number in the figures represents proportion of CD4+ Foxp3+ Treg compared with CD4+ T lymphocytes. (F) proportion of beta-gal epitope specific CD8+ T lymphocytes compared with total CD8+ T lymphocytes in the tumor. (G) proportion of CD8+ T lymphocytes compared with Treg in the tumor.

