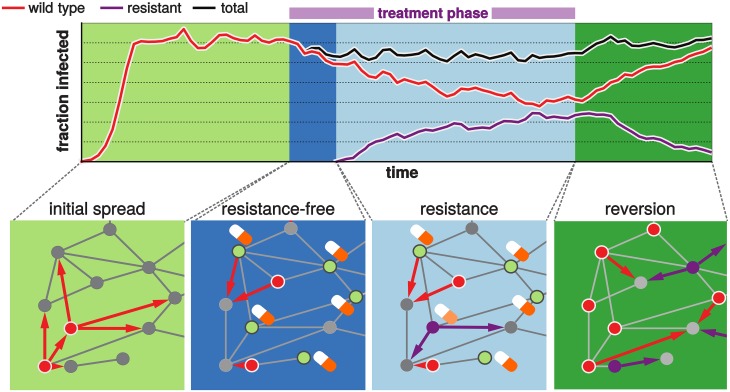
Fig 1. Simulation of the pathogen spread and treatment on a random host network.
The different background colors indicate absence (green) and presence (blue) of treatment. The phases in absence of treatment are the initial spread of the wild-type strain (light green) and the potential reversion back to wild type after treatment has stopped (dark green). Treatment is divided into the phases before (dark blue) and after (light blue) the de novo emergence of resistance. The solid lines indicate the fraction of hosts infected with either the wild type (red) or the resistant strain (purple). The black line gives the total fraction of infected hosts. The bottom panels illustrate the corresponding phases on the level of the individual hosts connected to each other. During the initial spread there are only two types of hosts: susceptibles (grey) and wild-type infecteds (red). The arrows indicate the transmission events from an infected to a susceptible host. During treatment two new types of hosts arise: In the resistance-free phase we only need to distinguish between treated (green with pill) and untreated (red) infecteds. In the resistance phase we additionally have resistant infected hosts (purple). Finally, in the reversion phase we loose the treated class of hosts and remain with susceptibles, wild-type and resistant infecteds. We generally assume that after recovery individuals are susceptible again and that treatment of resistant infecteds has no effect.

