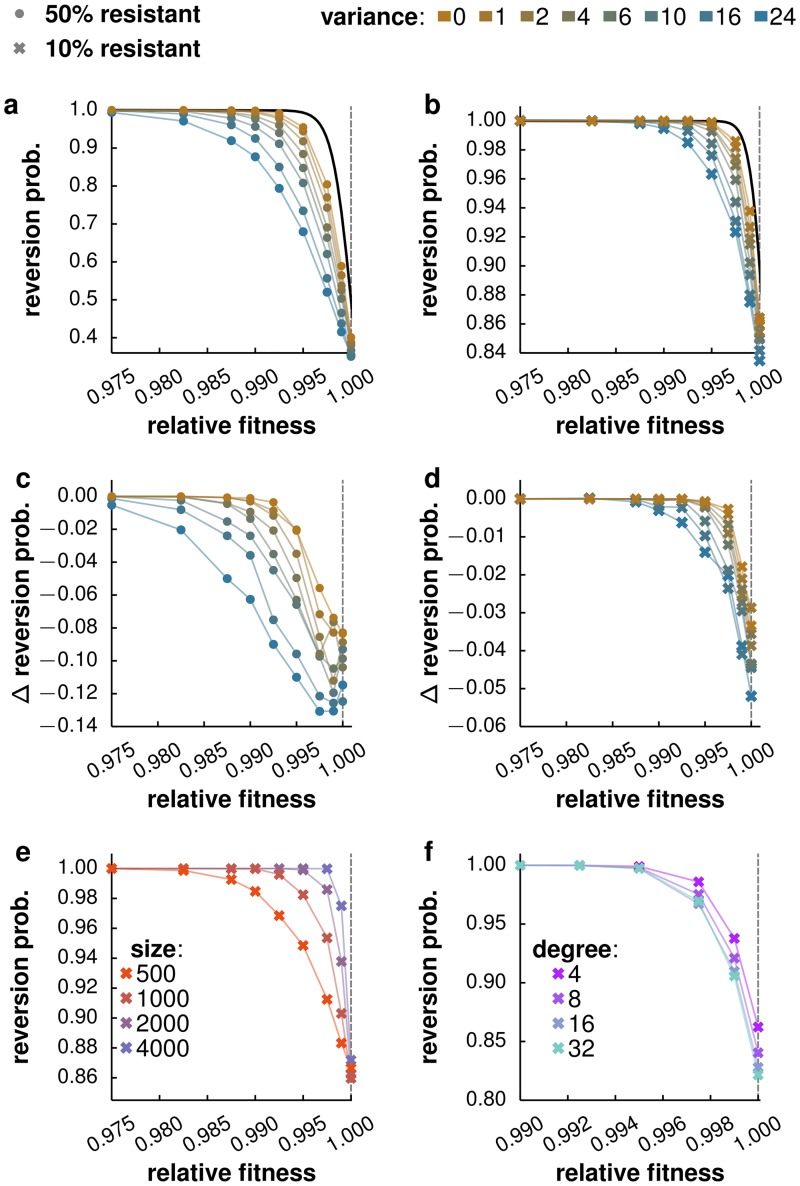
Fig 2. Effect of treatment halt, network size and density on reversion probability.
a,b. Probability of reversion after a gradual treatment halt as a function of the relative fitness of the resistant strain for critical resistance fractions fr = 0.5 and 0.1, respectively. Almost certain reversion happens for sufficiently large fitness disadvantages of the resistant strain: relative fitness sA < 0.975 for a resistant fraction of fr = 0.5 and sA < 0.985 for fr = 0.1. As a reference, the analytical probability, using a Moran model [50], of reversion in a random host population with homogeneous degree is shown (black lines). The model for disease spread (coloured lines) shows generally a smoother transition as compared to the Moran model. In networks with higher variance in degree, the probability of reversion changes more gradually with relative fitness. c,d. Difference of the reversion probability between immediate and gradual treatment halt for fr = 0.5 and 0.1, respectively. In panels a-d color gradient indicate increasing variance of the degree distribution of the network. e. Probability of reversion as a function of the relative fitness of the resistant strain for host populations with zero degree variance and various system sizes. f. Reversion probability as a function of the relative fitness of the resistant strain for host populations with various densities (i.e. mean degrees) and zero variance. The change in connection density is compensated by adapting the transmission rate of the pathogen such that the epidemic threshold is kept constant, R0 = 3. In all simulations, treatment coverage is complete (c = 1) and drug efficacy is half maximal (e = 0.5).

