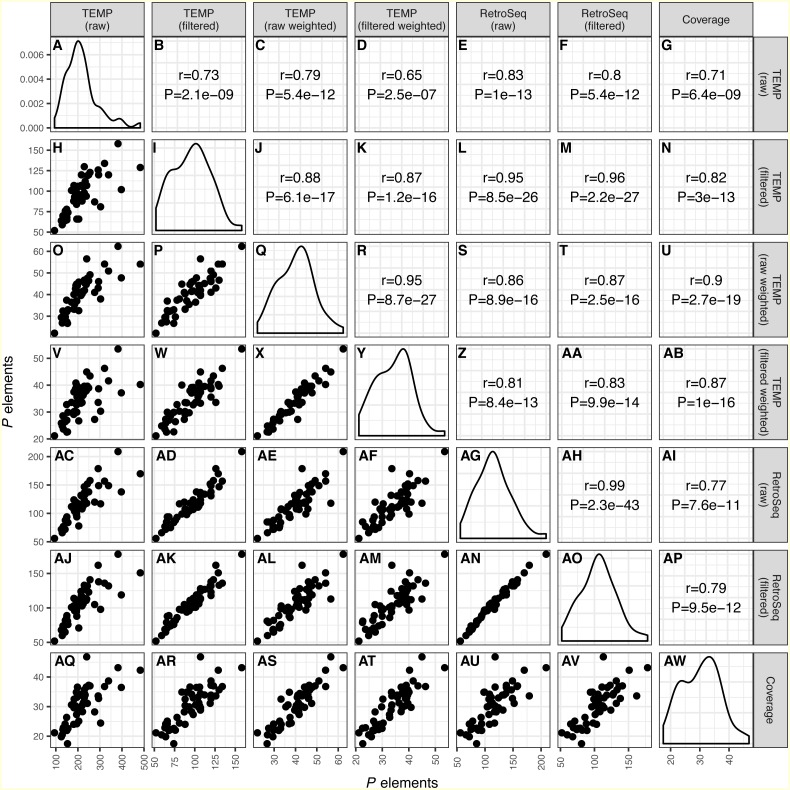
Figure 1. Correlation across different bioinformatics methods in numbers of predicted P elements for a worldwide sample of D. melanogaster isofemale strains from N. America, Europe and Africa. Numbers of P elements predicted by TEMP or RetroSeq shown are before (raw) and after (filtered) filtering by McClintock, and for TEMP are also weighted by sample frequency.
P element numbers based on coverage are estimated by normalizing coverage in exon 0 of the P element canonical sequence to the coverage of the unique regions of the major arms of the D. melanogaster genome. Each dot in H, O-P, V-X, AC-AF, AJ-AN, AQ-AV represents a single isofemale strain. Histograms in panels A, I, Q, Y, AG, AO, AW represent the distribution of the estimated number of P elements per strain. Numbers in B-G, J-N, R-U, Z-AB, AH-AI, AP represent the Pearson correlation coefficients and associated P-values for correlations between pairs of methods. Note that the scales on the x-axis and y-axis vary for each method.

