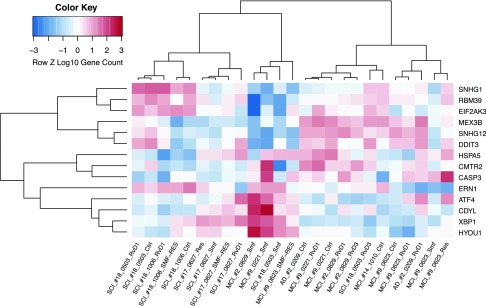
Figure 6.
Hierarchical cluster and heatmap of ER stress genes in stimulated Mϕs. Heatmap and dendrogram of Mϕ expression levels exposed to different compounds: RvD1, RvD3, resveratrol (Res), SMF, SMF/Res, or negative control (Ctrl). Expression measured by their relative expression level (z score) after log10 transformation for ER stress genes (rows) across Mϕ samples (columns). Each cell represents relative expression level with respect to other samples for a single gene, where red indicates a higher expression level and blue indicates a lower expression level. MFI, mean fluorescence intensity. *P < 0.01.

