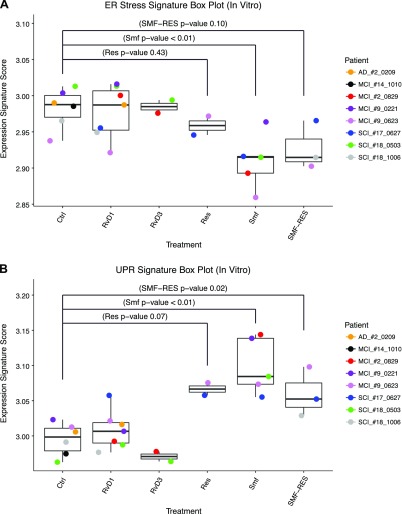
Figure 8.
ER stress signature gene expression box plot (Mann-Whitney Wilcoxon). Replicate Mϕ cultures were exposed to different compounds: RvD1, RvD3, resveratrol (Res), SMF, SMF/Res, or negative control (Ctrl). Box plots of ER stress signature scores under different treatment conditions. Mann-Whitney Wilcoxon test of ER stress signatures scores between ctrl samples to the Res, SMF, and SMF/Res groups produced unadjusted values of P < 0.43, P < 0.01, and P < 0.10, respectively. B) UPR signature gene expression box plot (Mann-Whitney Wilcoxon). P < 0.07, P < 0.01, P < 0.02, calculated between Res, SMF, and SMF/Res groups, respectively, to control samples.

