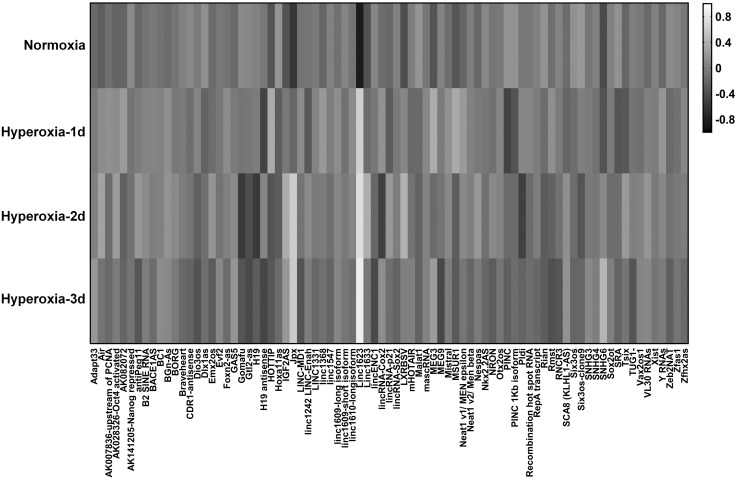
Figure 1.
LncRNA profile in mouse lung tissue during HALI. The heatmap was generated using hierarchical cluster analysis to show distinct lncRNA expression patterns in lung tissues between normoxia- and hyperoxia-treated mice. The intensity values were log10 transformed, centered by the mean of individual genes across all 4 groups, and subjected to cluster analysis for generating the heatmap. The bar was extracted to show the gray contrast level of the heatmap. White and black indicate high and low expression levels, respectively.

