Fig. 3.

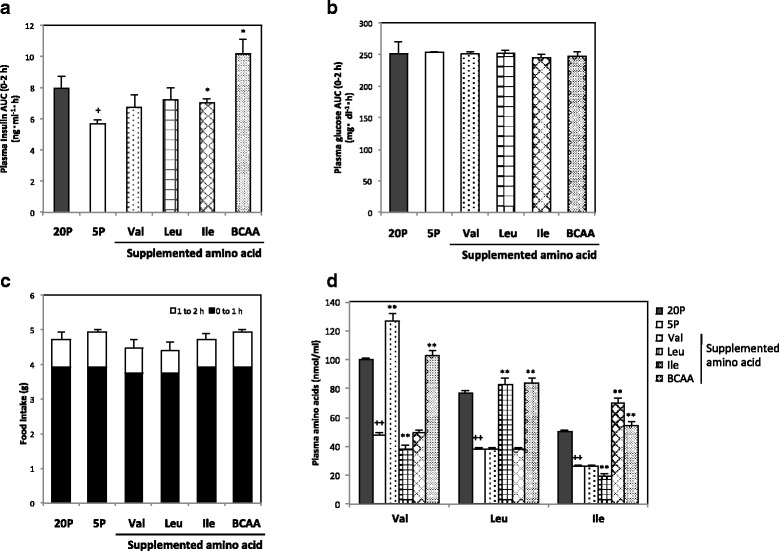
Plasma insulin, glucose, and amino acid concentrations and food consumption during feeding BCAA-supplemented diets in rats. Rats were fed a control diet with 20% casein (20P), a low-protein diet with 5% casein (5P), or diets supplemented with Val, Leu, Ile, or three BCAAs (BCAA) to 5P for 8 h. Plasma insulin and glucose concentrations from 0 to 2 h after feeding are shown as AUC (a and b, respectively), food consumptions for 0–1, 1–2 h after feeding are shown as a cumulative bar chart (c), and plasma BCAA concentrations 30 min after feeding are also shown (d). Values are expressed as means ± S.E.M. (n = 5 in each group). Results of statistical analysis are given above the graphs (+ P < 0.05, ++ P < 0.01 vs. 20P; *P < 0.05, **P < 0.01 vs. 5P)
