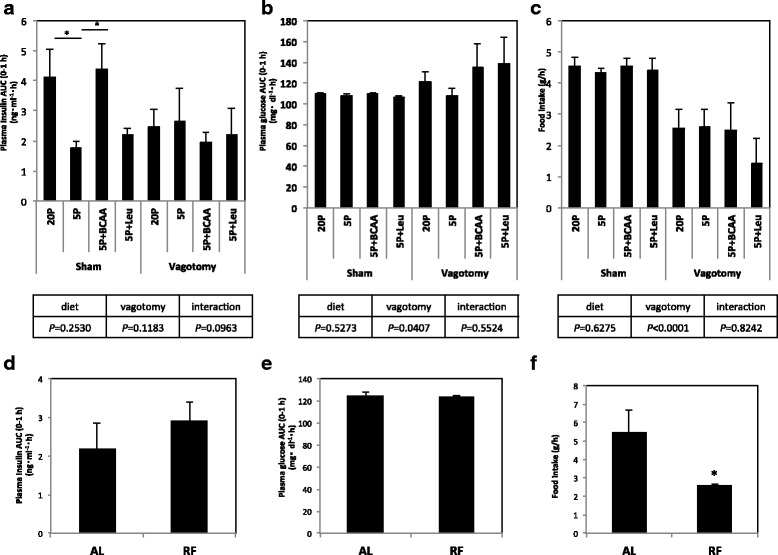
Fig. 5.

Effect of vagotomy and food restriction on plasma insulin, glucose, and amino acid concentrations in rats. a–c Vagotomized or sham-operated rats were fed a control diet with 20% casein (20P), a low-protein diet with 5% casein (5P), 5P supplemented with three BCAAs (5P + BCAA), or 5P supplemented with Leu (5P + Leu) for 1 h. Plasma insulin and glucose concentrations from 0 to 1 h after feeding are shown as AUC (a and b, respectively), and food consumption for 1 h after feeding is also shown (c). Values were expressed as means ± S.E.M. (sham 20P, n = 4; sham 5P, n = 5; sham 5P + BCAA, n = 5; sham 5P + Leu, n = 4; vagotomy 20P, n = 7; vagotomy 5P, n = 3; vagotomy 5P + BCAA, n = 4; vagotomy 5P + Leu, n = 3). Differences between 20P vs. 5P, 5P vs. 5P + BCAA, and 5P vs. 5P + Leu of the same operation group were statistically analyzed, and the results are given above the graphs (*P < 0.05). In addition, P-value of two-way ANOVA is shown below each graph. d–f Rats were fed a control diet with 20% amino acid (20AA) ad libitum (AL) or restricted to 2.5 g (RF) for 1 h. Plasma insulin and glucose concentrations from 0 to 1 h after feeding are shown as AUC (d and e, respectively), and food consumptions for 0–1 h after feeding are also shown (c). Values are expressed as means ± S.E.M. (AL, n = 3; FR, n = 4 in each group). Results of statistical analysis are given above the graphs (*P < 0.05 vs. AL)
