Fig. 4.

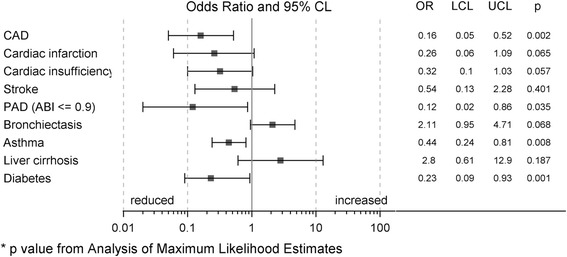
Distribution of comorbidities in AAT-COPD patients: Forest plot for the adjusted influence of AATD (yes/no) on different comorbidities (odds ratios are derived from multivariable logistic regression models)

Distribution of comorbidities in AAT-COPD patients: Forest plot for the adjusted influence of AATD (yes/no) on different comorbidities (odds ratios are derived from multivariable logistic regression models)