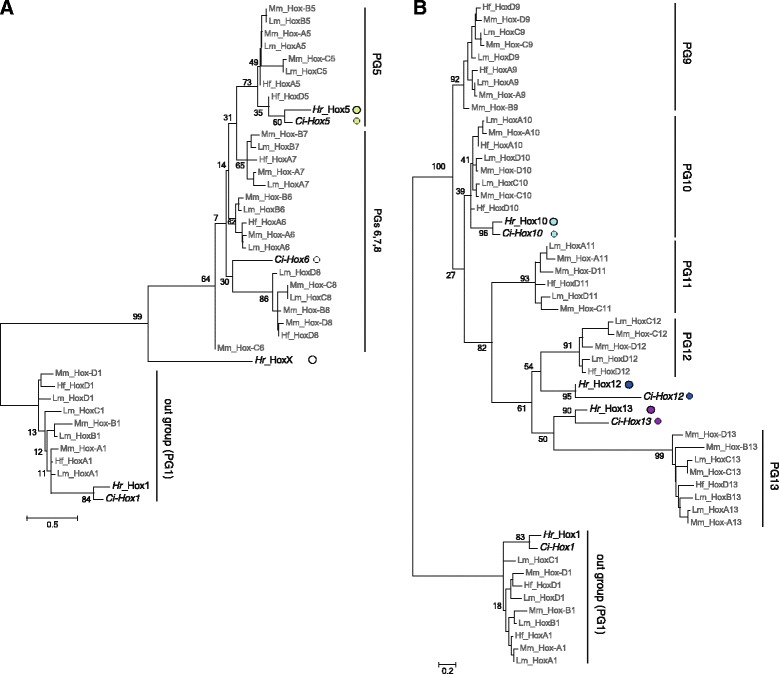
Fig. 2.

Phylogenetic analysis of Hox gene candidates of Halocynthia roretzi, using PGs 5–8 a and PGs 9–13 b genes, and PG1 genes were used as an out group. The ML tree was constructed using homeodomain sequences and the adjacent 20 N-terminal side and seven C-terminal side amino acid residues (see Additional file 1: Figure S1) with MEGA5 software and 1000 replicates. The percentage of replicated trees in which the clustering of genes was supported is indicated at the nodes. Within a clade consisting of only vertebrate Hox genes, the percentage was not indicated at the node. Colored circles to indicate ascidian genes and taxonomic abbreviations are the same as in Fig. 1. The bars at the bottom indicate amino acid substitutions per position in the sequence
