Fig. 2.

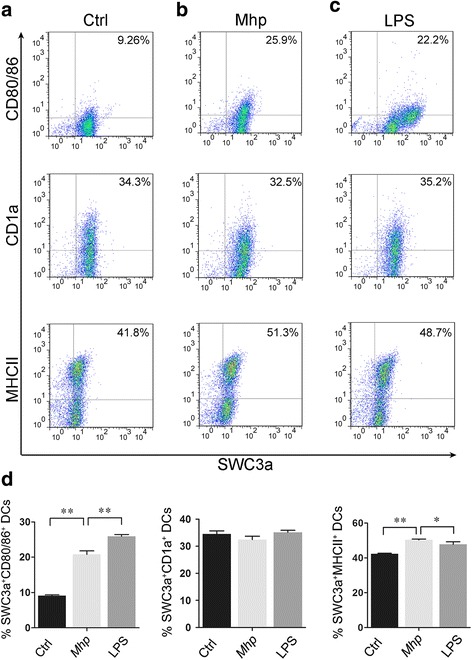
Expression of antigen presenting molecules and co-stimulatory molecules on DCs after vaccine Mhp-168 exposure at 24 h.p.i. Immature BMDCs were exposed to vaccine Mhp-168 (40/dendritic cell) or LPS (10 ng/ml) as positive control for 24 h. Dot plots show the percentage of CD1a+SWC3a+DCs, CD80/86+SWC3a+ DCs and MCHII+SWC3a+ DCs. a Untreated BMDCs. b Mhp 168 treated DCs. c LPS treated DCs. d Bar graphs show the percentage of CD1a+SWC3a+, CD80/86+SWC3a+, MHCII+SWC3a+ cells in BMDCs populations after vaccine Mhp-168 exposure. Data show the means ± SEM (n = 3 per group). All experiments were performed independently three times. Statistical significance was assessed by Student’s t-test. Differences were considered significant at (*) 0.01 < p < 0.05, (**) p < 0.01
