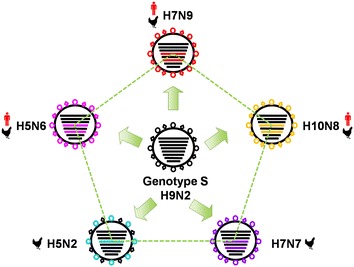
Figure 2.

Illustrative scheme of the events induced by reassortment of whole set of internal genes from H9N2 to generate novel influenza A reassortants. The eight horizontal bars in circle (from top to bottom) represent PB2, PB1, PA, HA, NP, NA, M and NS genes, respectively. The ring and prismatic shape on outer surface of circle represent the HA and NA proteins, respectively. Each color represents a specific virus subtype. The black poultry label indicates that the generated influenza A virus challenges birds and the red figure label indicates that the reassortant can also infect human beings.
