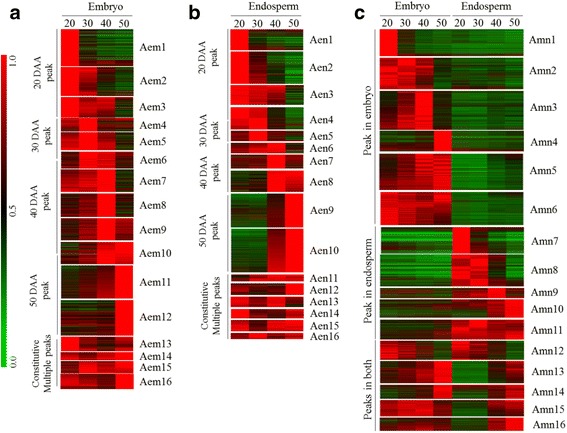
Fig. 4.

Co-expression gene clusters of AC Domain (A). All probesets expressed in the embryo (a), endosperm (b) or both (c) at one or more time points were clustered based on the peak expression at a given time point(s) during seed maturation. The expression level of probesets in each of the embryo (em) (a), endosperm (en) (b) or both (mn) (c) tissues was determined relative to a time point with the highest RMA-normalized signal intensity, which was arbitrarily set to a value of 1 and represented by red color in the red-green scale shown on the left side of the heat map
