
Fig. 2.
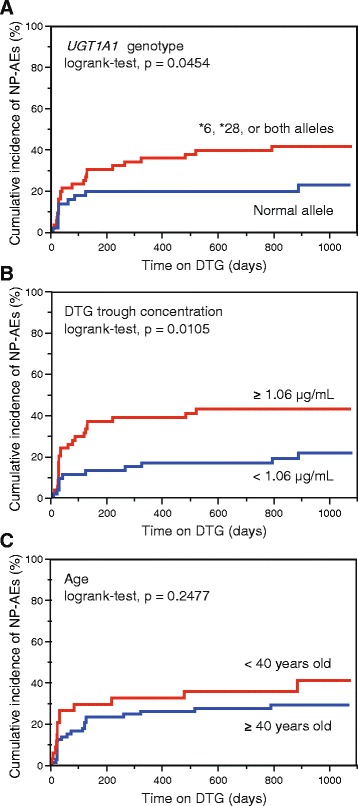
Kaplan-Meier estimation of the cumulative incidence of neuropsychiatric adverse events (NP-AEs). a Blue, and red lines indicate the Kaplan-Meier curves in the subjects carrying both normal alleles, and UGT1A1*6, UGT1A1*28, or both alleles, respectively. b Comparison between the subjects with lower (< 1.06 μg/mL, blue line) and higher (≥ 1.06 μg/mL, red line) plasma DTG trough concentrations. c Comparison between older (≥ 40 years old, blue line) and younger (red line) subjects