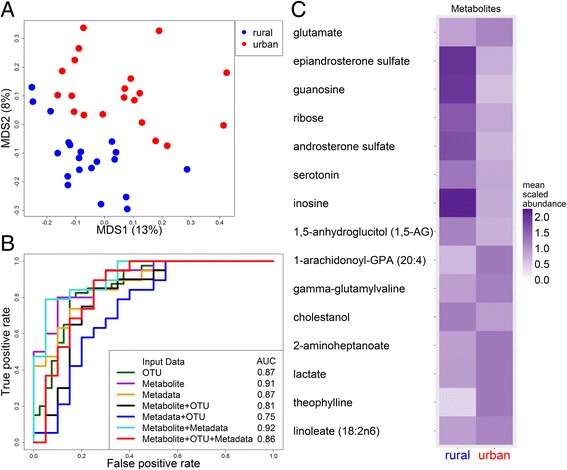
Fig. 3.

Differences in metabolites between urban and rural Chinese subjects. a PCoA plot comparing metabolites between urban (red) and rural (blue) samples. Numbers in parentheses indicate the percent variation explained by that axis. The urban/rural P value was 0.02 for MDS1 and 1.5 × 10⁻⁷ for MDS2. b ROC curve using leave-one-out predictions of urban or rural status using a random forest classifier. The area under the curve (AUC) is indicated in the legend. c Heatmap showing the mean scaled abundance of metabolites statistically significantly different between urban and rural samples after correction for multiple hypothesis testing (adjusted p < 0.05). Metabolites are given from most to least significant. 334 different biochemicals were tested (see Additional file 6: Table S2G for more details, including mean and standard deviation, P values and model R 2)
