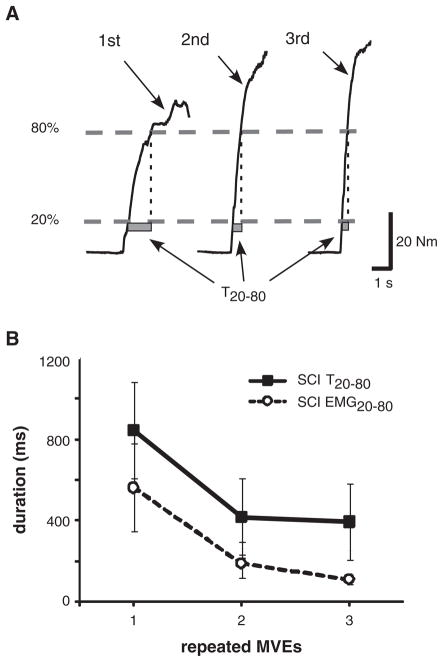
Figure 3. Representative Data.
Note: (A) One subject with spinal cord injury (SCI) portraying increasing rate of torque increase (indicated by shorter T20–80 duration; gray bars) during the first 3 repeated maximal volitional efforts (MVEs). (B) The mean alterations in T20–80 and EMG20–80 in subjects with SCI. Differences in T20–80 and EMG20–80 from the 1st to 2nd repeated MVEs were significantly correlated (r = 725; P < .001). EMG, electromyographic data.

